🌍 Capture the world at 100% OFF! Use code ongeo100on 10 meters satellite image resolutions – limited time only! Higher resolution satellite images remain subject to payment.
🌍 Capture the world at 100% OFF! Use code ongeo100on 10 meters satellite image resolutions – limited time only! Higher resolution satellite images remain subject to payment.
How Free Satellite Imagery Can Help Farmers Optimize Crop Management
2025-04-23
(Article updated:
2025-04-23
)
~ 6 min
Farmers, imagine getting crucial insights into your crop health and soil moisture without setting foot in every corner of the field. Free satellite imagery for farmers is transforming agriculture, providing actionable data to monitor crops, manage water resources, and optimize farming practices for better yields and sustainability. Tools like free Sentinel satellite imagery empower data-driven decisions. Platforms such as OnGeo Intelligence simplify access to this technology, offering easy-to-understand reports enhanced with AI for precision farming needs.
High-Quality Satellite Imagery, Hassle-Free
Explore any location on Earth with precision. Order a detailed Satellite Imagery Report—no sign-ups, no contracts. Delivered in a clear PDF for instant insights.
What are remote sensing indices and why do they matter for farmer's crop management?
Remote sensing indices are mathematical formulas that use satellite data to analyze specific aspects of vegetation, soil, and water conditions. These indices help farmers understand their fields better and make informed decisions. Here are three key indices included in the Satellite Imagery Report from OnGeo Intelligence. Learn more about remote sensing indices in our article: The remote sensing indices NDVI, NDMI, and NDWI.
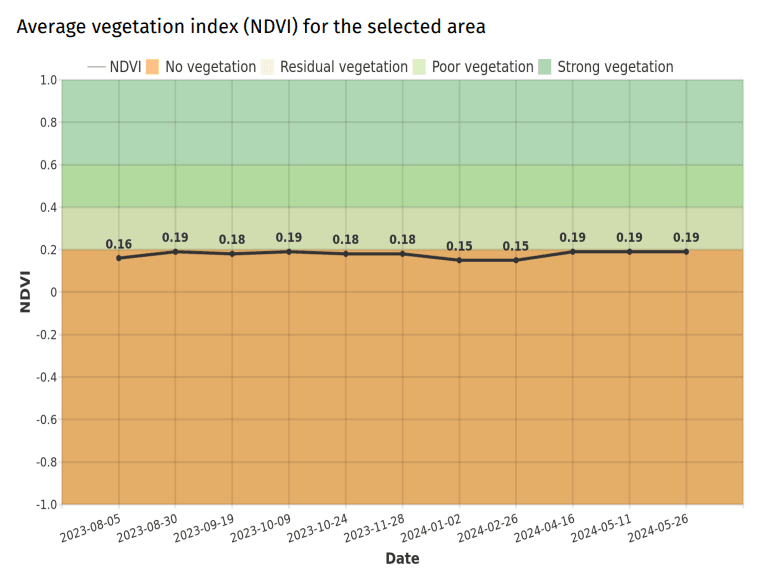
Normalized Difference Vegetation Index (NDVI)
Normalized Difference Vegetation Index (NDVI)
Example visualization of the NDVI index from the OnGeo Intelligence Satellite Report, indicating variations in crop vegetation health. Greener areas typically represent healthier, more vigorous vegetation.
What it measures: Vegetation health and density by comparing near-infrared (NIR) light (reflected strongly by healthy plants) and red light (absorbed for photosynthesis).
What NDVI Tells Farmers: Indicates overall crop health and vigor, helps identify areas under stress (e.g., nutrient deficiency, pests, disease), and allows tracking of growth stages. High NDVI generally means healthier vegetation.
Formula: NDVI = (NIR - Red) / (NIR + Red)
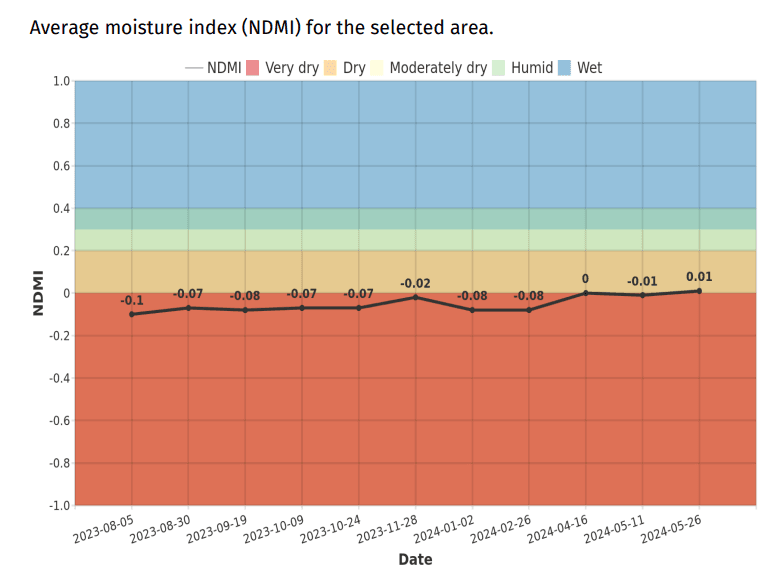
Normalized Difference Moisture Index (NDMI)
Visualization of the NDMI index from the OnGeo Intelligence Satellite Report. Differences in color reflect variations in vegetation and soil moisture content, helping to identify areas potentially under drought stress.
What it measures: Water content within plant leaves, using near-infrared (NIR) and short-wave infrared (SWIR) light.
What NDMI Tells Farmers: Helps identify areas experiencing water stress (drought) often before visual symptoms appear, crucial for optimizing irrigation schedules and managing water resources efficiently.
Formula: NDMI = (NIR - SWIR) / (NIR + SWIR)
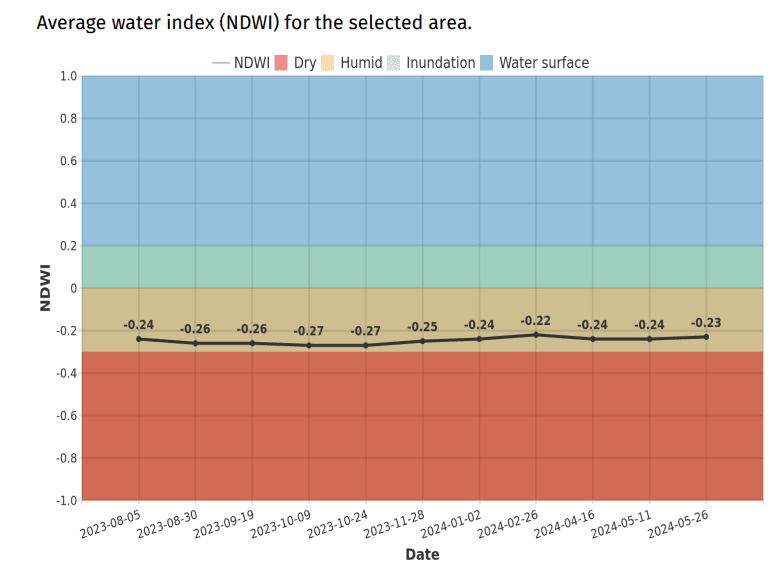
Normalized Difference Water Index (NDWI)
Example map of the NDWI index from the OnGeo Intelligence Satellite Report, useful for monitoring the water content in plant canopies and identifying surface water bodies.
What it measures: Primarily changes in water content of vegetation canopies, using near-infrared (NIR) and green light. Often used for identifying surface water bodies as well.
What NDWI Tells Farmers: Monitors vegetation water stress, can help optimize irrigation efficiency, and track changes in surface water availability within or near fields.
Formula: NDWI = (Green - NIR) / (Green + NIR) (Note: There are variations of NDWI; ensure this formula aligns with the one used in the report/linked article)
How satellite imagery transforms agriculture practices
Monitoring Crop Health Efficiently
Satellite imagery gives you a regular, objective overview of your fields, allowing for early detection of problems:
Pinpoint underperforming areas using NDVI maps to investigate potential nutrient issues or pest outbreaks.
Identify zones affected by disease or stress impacting overall crop vigor.
Monitor water stress patterns using NDWI or NDMI analysis. Early intervention based on these insights improves crop quality, maximizes yield, and minimizes losses.
Optimizing Water Management
Water is a precious resource. Satellite imagery helps farmers use it more effectively:
Assess soil moisture variability using NDMI to guide irrigation timing and volume, preventing both overwatering and drought stress.
Plan more precise irrigation schedules based on crop water needs indicated by indices like NDWI.
Enabling Precision Agriculture
Treating entire fields uniformly is often inefficient. Satellite data enables zone-based management:
Create management zones based on productivity potential revealed by historical or current NDVI maps.
Apply inputs (fertilizers, pesticides, seeds) at variable rates tailored to each zone’s specific needs, potentially reducing input costs significantly (studies suggest up to 30% savings).
Increase overall yield by focusing resources where they provide the most benefit.
Why choose OnGeo Intelligence for free satellite imagery for farmers?
Example analysis of remote sensing indices (NDVI, NDMI, NDWI) available in the OnGeo Intelligence Satellite Report.
While accessing raw free satellite data is possible elsewhere, OnGeo Intelligence makes it practical and actionable for busy farmers:
Free access & added value: Use code ongeo100 for a free report with AI-enhanced 10m resolution imagery. Crucially, this report includes calculated indices.
Mobile-friendly platform: Order and review reports directly from your smartphone or tablet while out in the field.
Clear PDF reports with index analysis: Receive organized, easy-to-interpret PDF reports with images ordered chronologically and graphs showing changes in NDVI, NDMI, and NDWI values over time for your specific area.
Global coverage: Analyze fields anywhere in the world.
Included data package: Get visible band channels plus NIR and SWIR bands for optional deeper analysis in desktop GIS software.
With the exclusive code ongeo100, you can generate professional free satellite imagery reports, including graphs showing changes in NDVI, NDMI, and NDWI values.
Go to the order form and easily select your field(s) using the interactive map.
Specify the time period you want to analyze.
Apply code ongeo100 during checkout to unlock your free report.
Receive your comprehensive report (including index graphs) via email, often within minutes!
Watch a step-by-step guide
Who can benefit from free satellite imagery?
Satellite imagery isn’t just for large-scale operations—it’s a valuable tool for a wide range of users:
Farmers
Monitor crop health, optimize irrigation schedules, and improve yields with data-driven insights.
Agricultural Advisors
Provide clients with actionable recommendations based on accurate satellite data.
Government Agencies
Evaluate land use, enforce regulations, and plan agricultural policies effectively.
Researchers
Analyze long-term trends in vegetation health and soil conditions.
Technology Enthusiasts
Explore modern geospatial technology and its applications in agriculture.
Satellite imagery is revolutionizing agriculture by providing farmers with actionable insights for their crop management that improve efficiency, reduce costs, and promote sustainability. With platforms like OnGeo Intelligence, accessing this technology has never been easier - or more affordable.
Don’t miss this opportunity to optimize your farming practices with free satellite imagery! Use code ongeo100 today and experience the benefits firsthand.
We use cookies to run our website, analyze your use of our services, manage your online preferences & personalize ad content. By accepting our cookies, you'll get relevant content and social media features, personalized ads, and an enhanced browsing experience. To manage your choices, click "Cookie Settings." Necessary cookies are required for the core website functionality and cannot be rejected. For more information, see our Cookie Policy.
About cookies on this site
Cookies used on the site are categorized. Below you can allow or deny some or all of them, except for Necessary Cookies which are required to provide core website functionality. When categories that have been previously allowed are disabled, all cookies assigned to that category will be removed from your browser.
Some cookies are required to provide core functionality. The website won't function properly without these cookies and they are enabled by default and cannot be disabled.
Preference cookies enables the web site to remember information to customize how the web site looks or behaves for each user. This may include storing selected currency, region, language or color theme.
Analytical cookies help us improve our website by collecting and reporting information on its usage.
Marketing cookies are used to track visitors across websites to allow publishers to display relevant and engaging advertisements. By enabling marketing cookies, you grant permission for personalized advertising across various platforms.
The cookies in this category have not yet been categorized and the purpose may be unknown at this time.