Spectral Bands: A Guide to Popular Index Formulas
Supporting environmental decisions with satellite and remote sensing tools plays a key role in today’s world. Current challenges related to climate change, natural resource monitoring, and rapid urban development require precise analysis of large datasets. Spectral Indexes help detect and monitor changes on the Earth's surface.
Spectral Indexes allow accurate assessment of vegetation health, soil moisture, water levels, and snow cover. They are crucial for scientific research and the development of new technologies like OnGeo Intelligence, which provides access to satellite imagery for remote sensing analysis.
Spectral bands and their role in remote sensing
Satellites capture electromagnetic radiation in different spectral bands, each measuring radiation at specific wavelengths. Examples include:
NIR – Near-Infrared
RED – Red light
BLUE – Blue light
- SWIR – Short-Wave Infrared
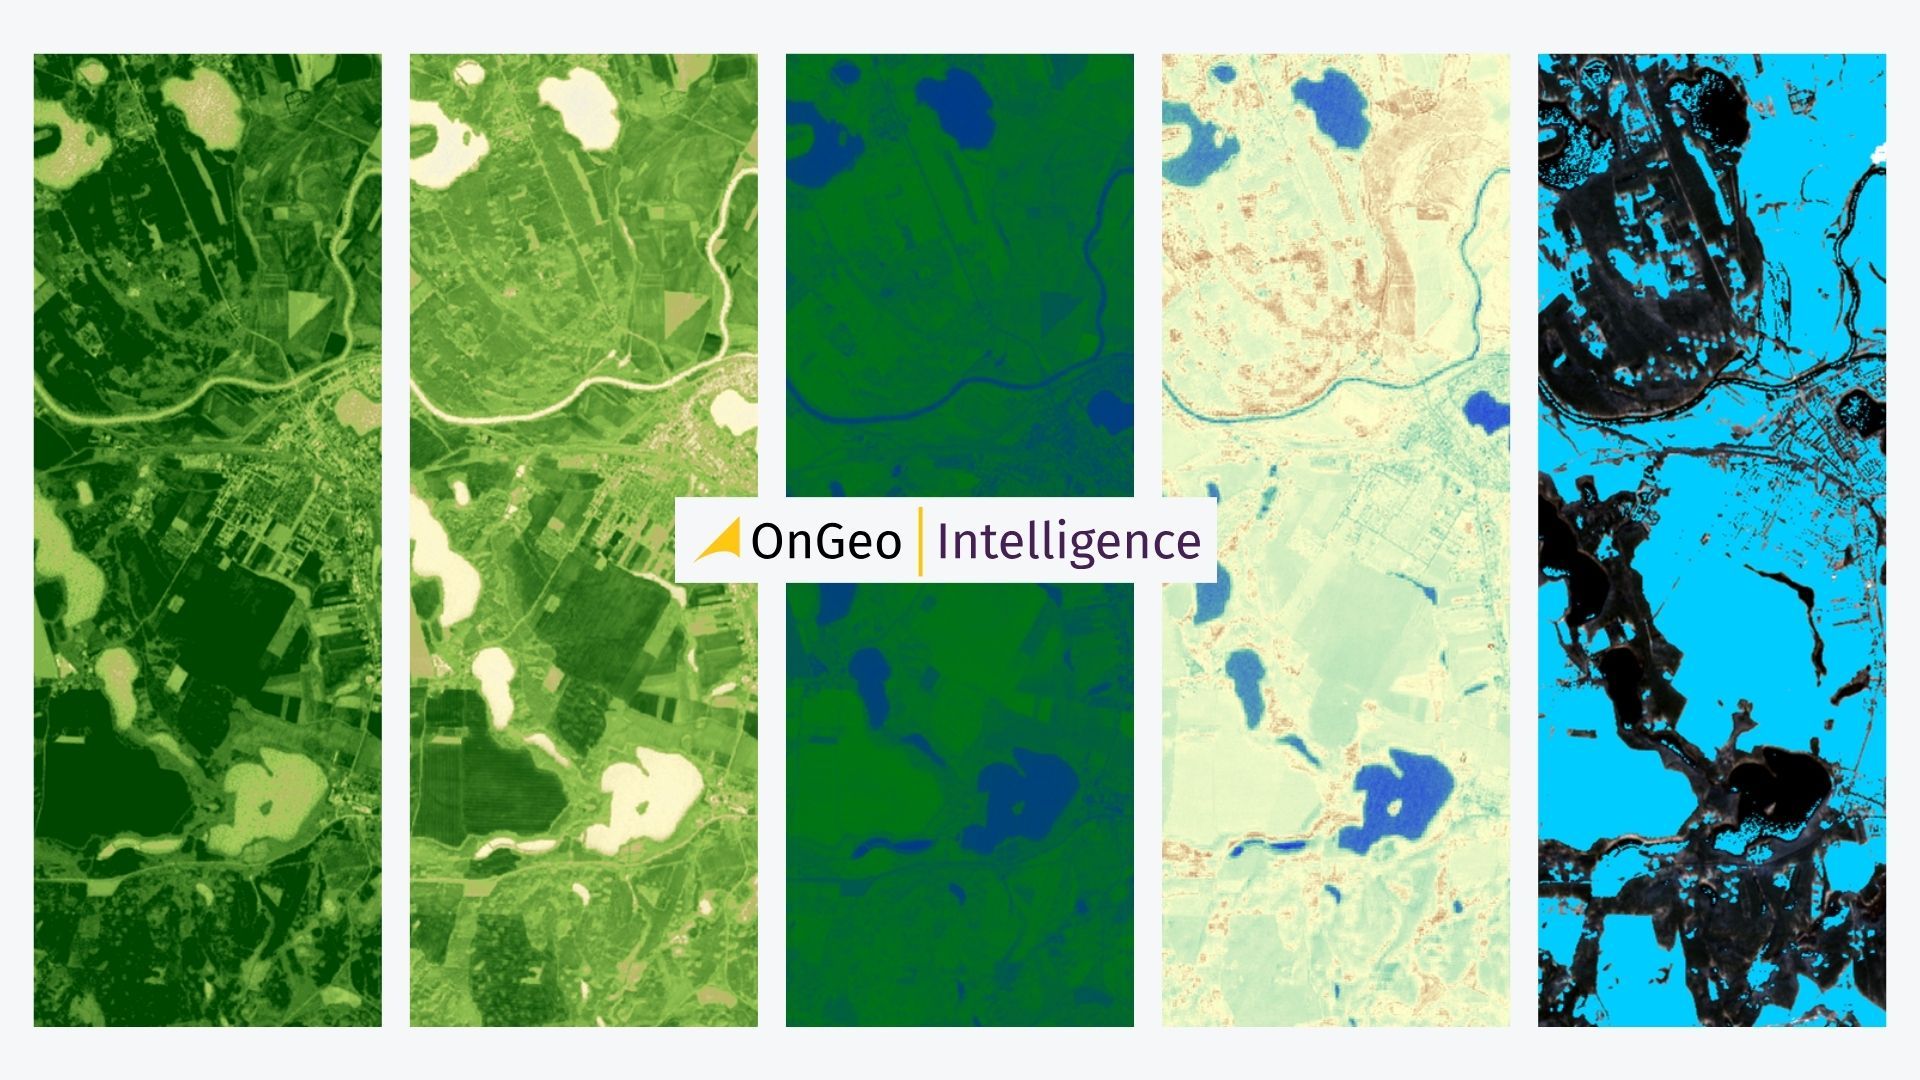
Most popular Spectral Indexes
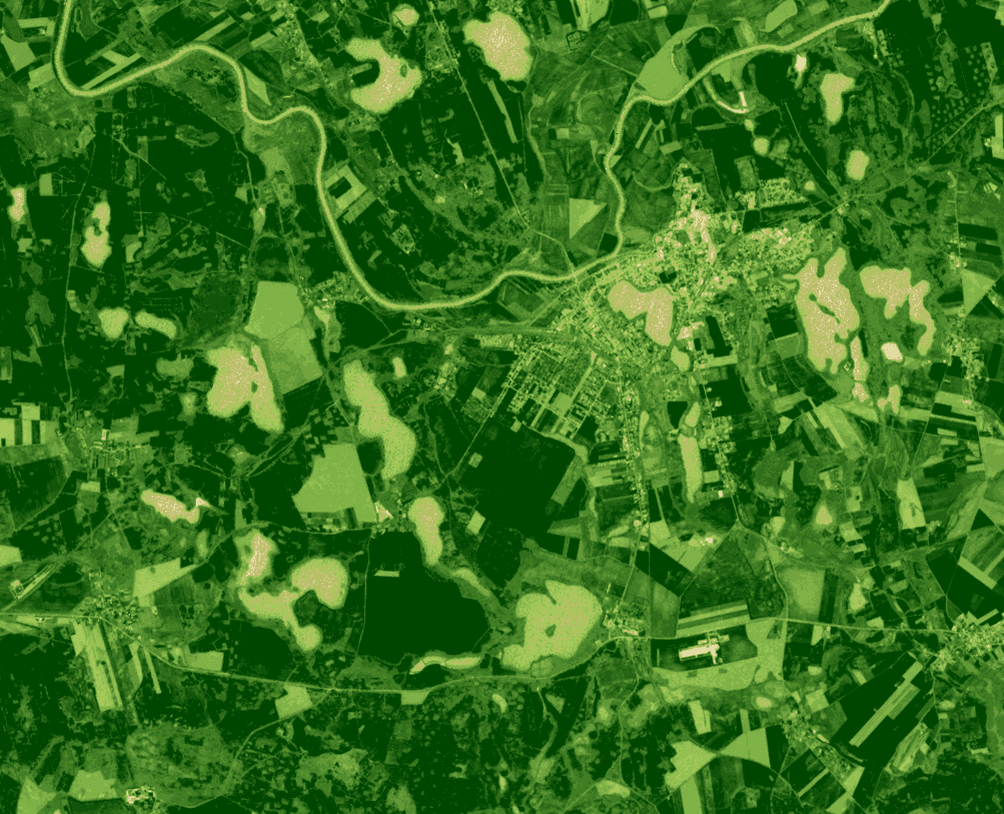
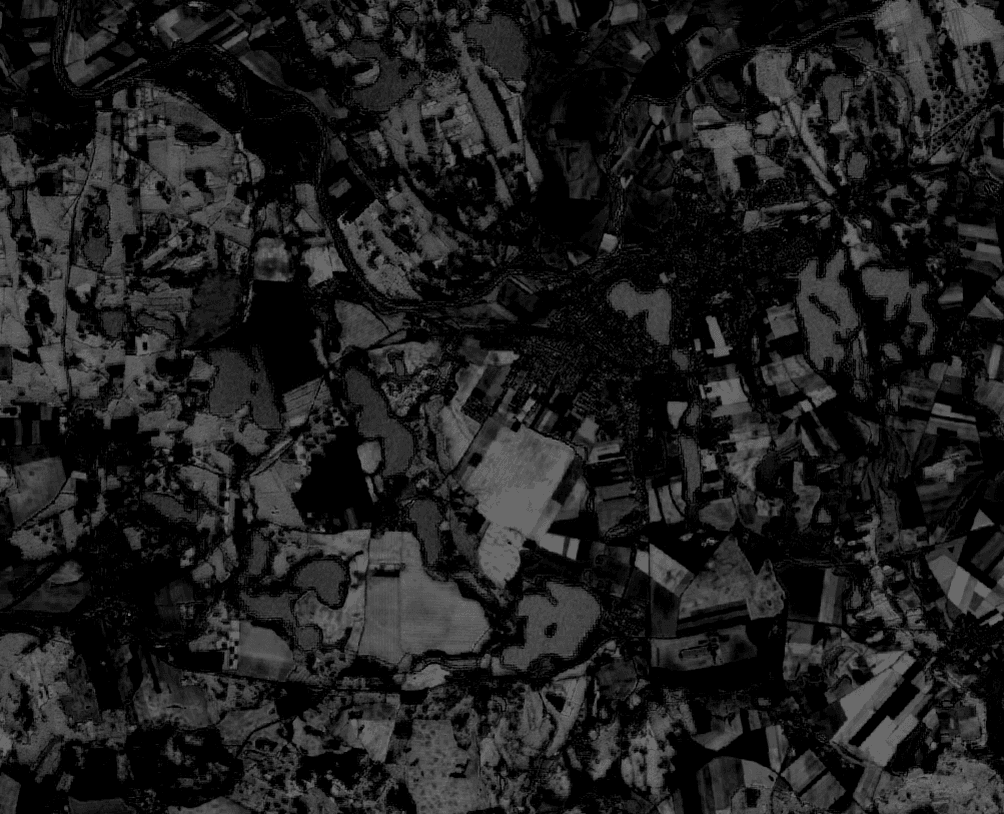
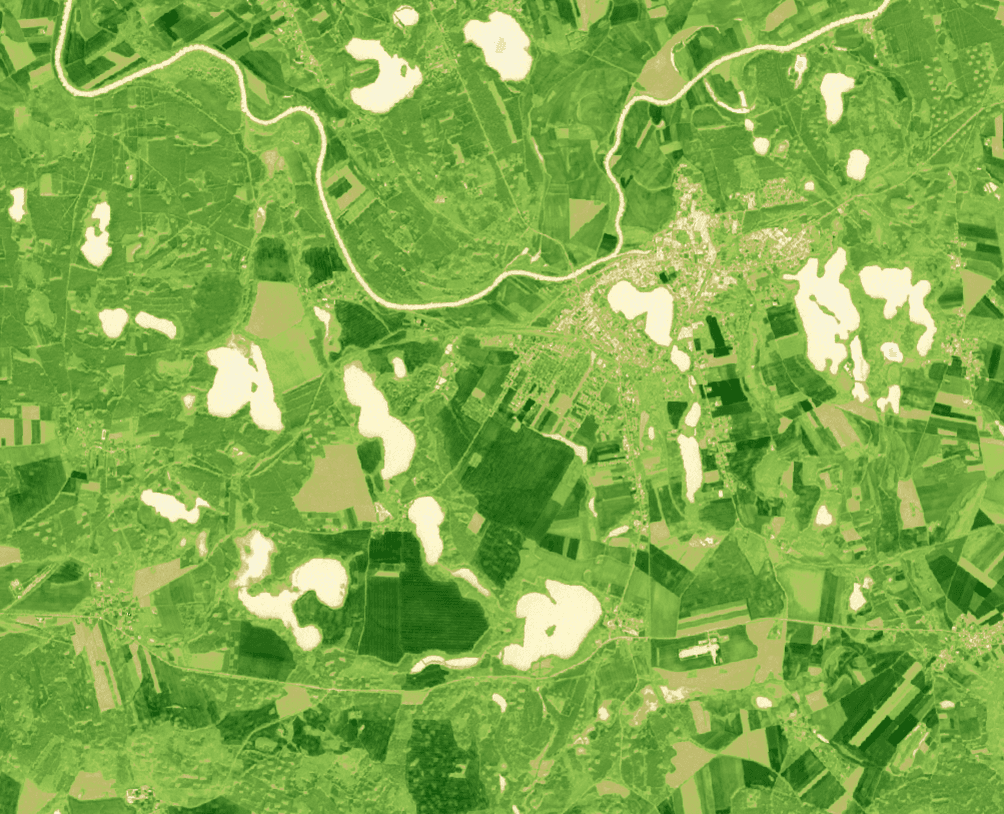
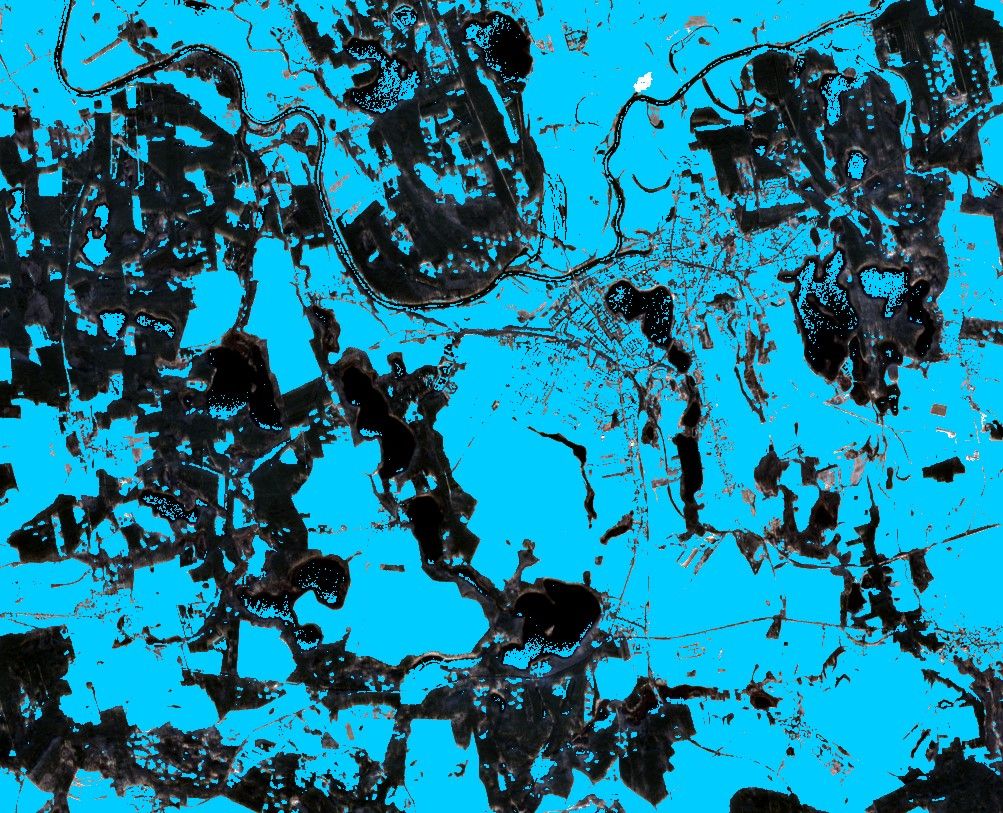
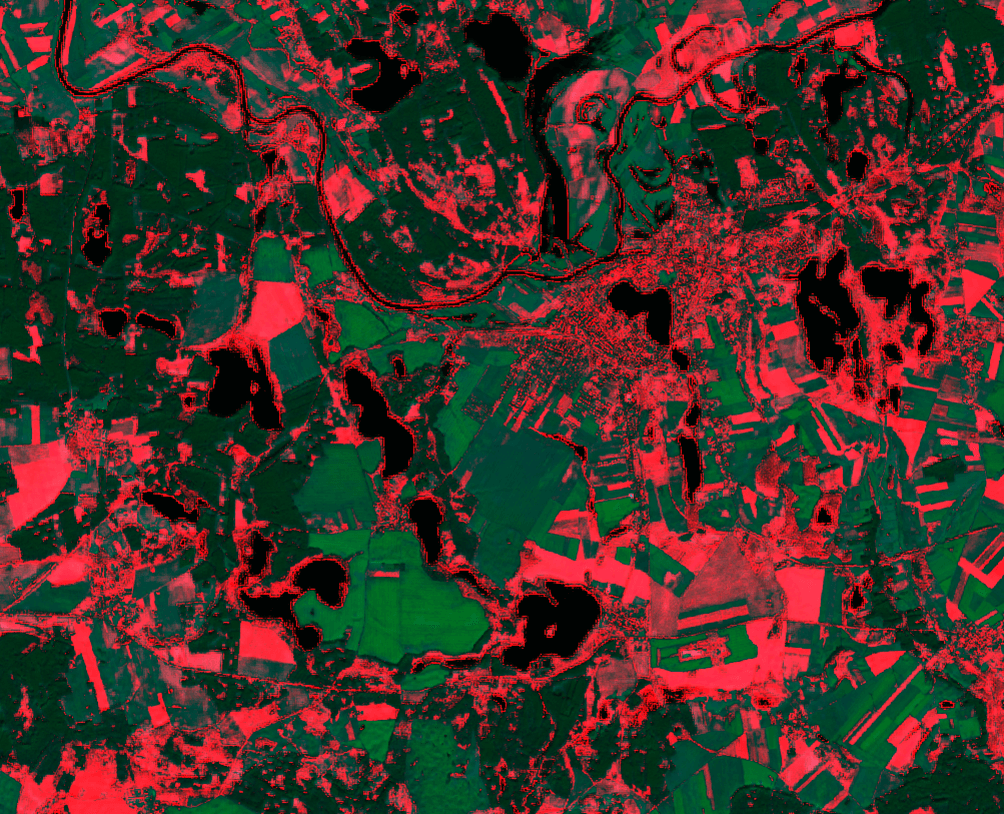
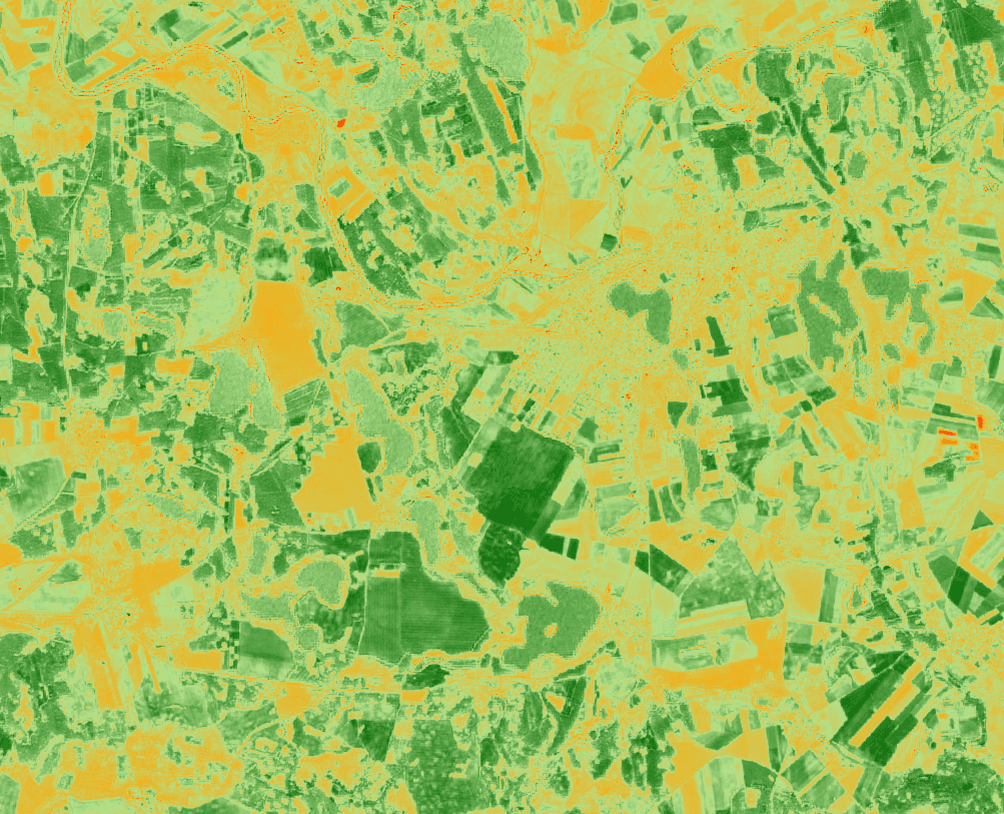
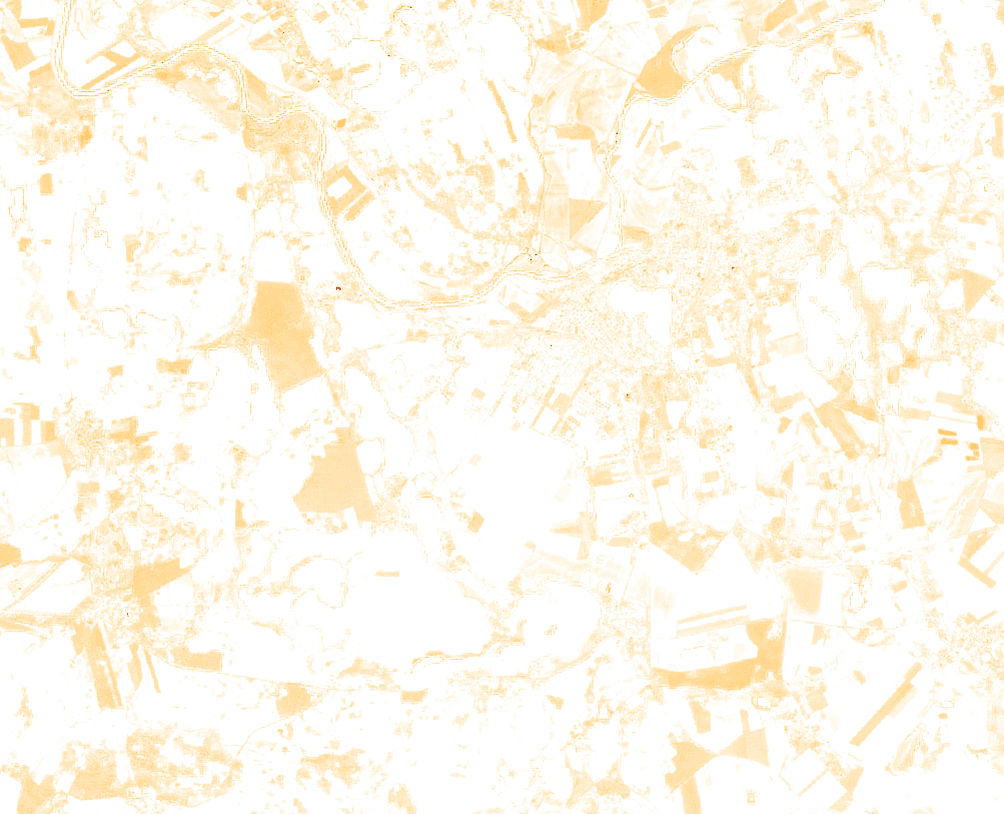
To start, it’s worth looking at a base satellite image without any Spectral Indices applied. Such an image allows you to clearly see the difference between raw data and the results obtained through Spectral Index calculations.
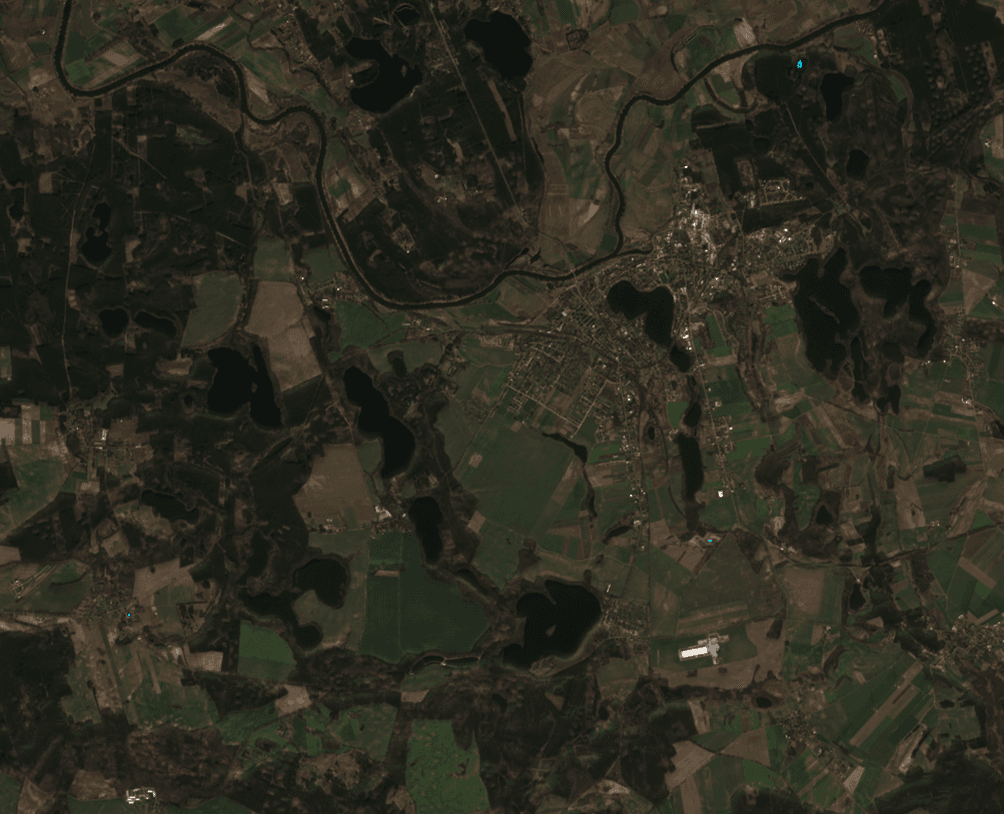
It should be remembered that individual Spectral Indexes perform with varying effectiveness depending on the type of land analyzed. Some Spectral Indexes work better in urban environments, allowing clear distinction of built-up areas, while others are more useful for agricultural fields, forests, or water body analysis.
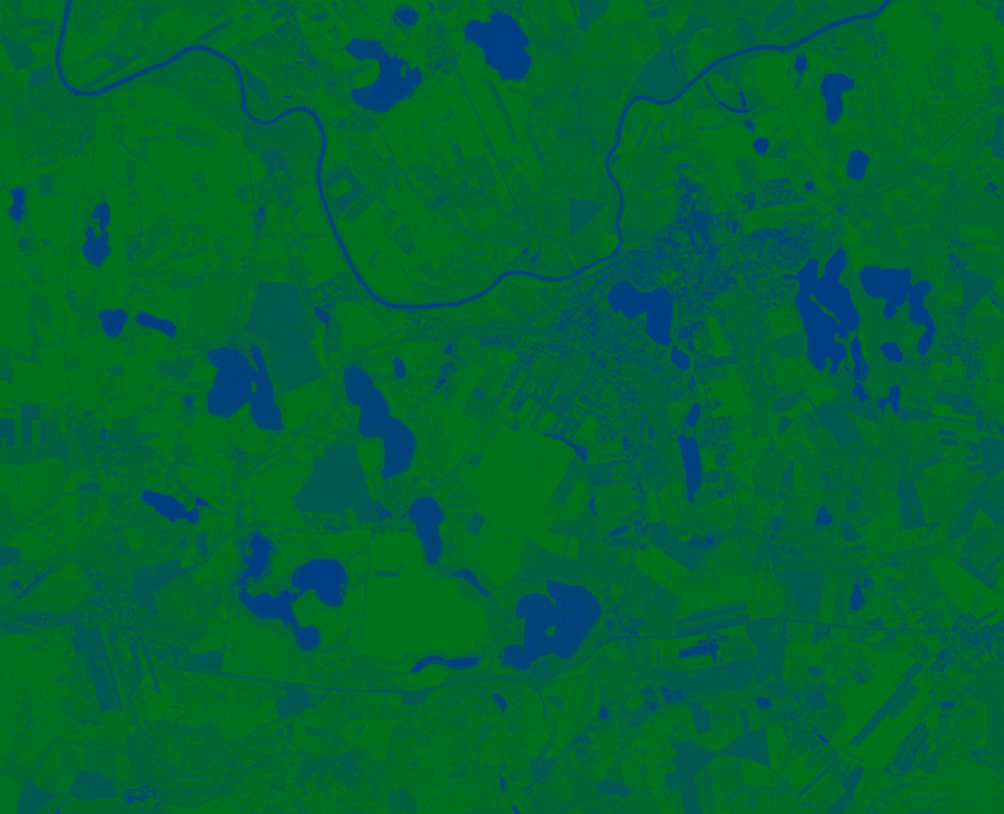
1. NDVI – Normalized Difference Vegetation Index
Application:
- Monitoring plant health: NDVI is used in agriculture to assess crop health and predict yields. Farmers can use this index to determine which parts of their fields need additional fertilization or irrigation.
- Tracking changes over time: Helps monitor how vegetation changes due to climate shifts or human activities like deforestation.
- Environmental protection: Used to monitor forests, especially in protected areas such as nature reserves and national parks.
Formula:
NDVI = (NIR − RED) / (NIR + RED)
2. NDII – Normalized Difference Infrared Index
Application:
- Monitoring vegetation moisture: NDII helps assess vegetation moisture levels, making it useful for detecting drought and crop water stress.
- Fire risk assessment: Identifies areas with low plant moisture that are more prone to wildfires, especially during dry seasons.
- Water resource management: Used in hydrological analysis to assess water availability in soil and vegetation over large areas.
Formula:
NDII = (NIR − SWIR) / (NIR + SWIR)
3. SAVI – Soil-Adjusted Vegetation Index
Application:
- Analyzing vegetation in low-cover areas: SAVI is ideal for desert and semi-desert regions where bare soil significantly influences measurement results.
- Use in arid regions: Designed to monitor vegetation in areas with minimal plant cover but significant soil influence.
Formula:
SAVI = ((NIR − RED) / (NIR + RED + L)) × (1 + L)
L – soil adjustment factor (commonly 0.5).
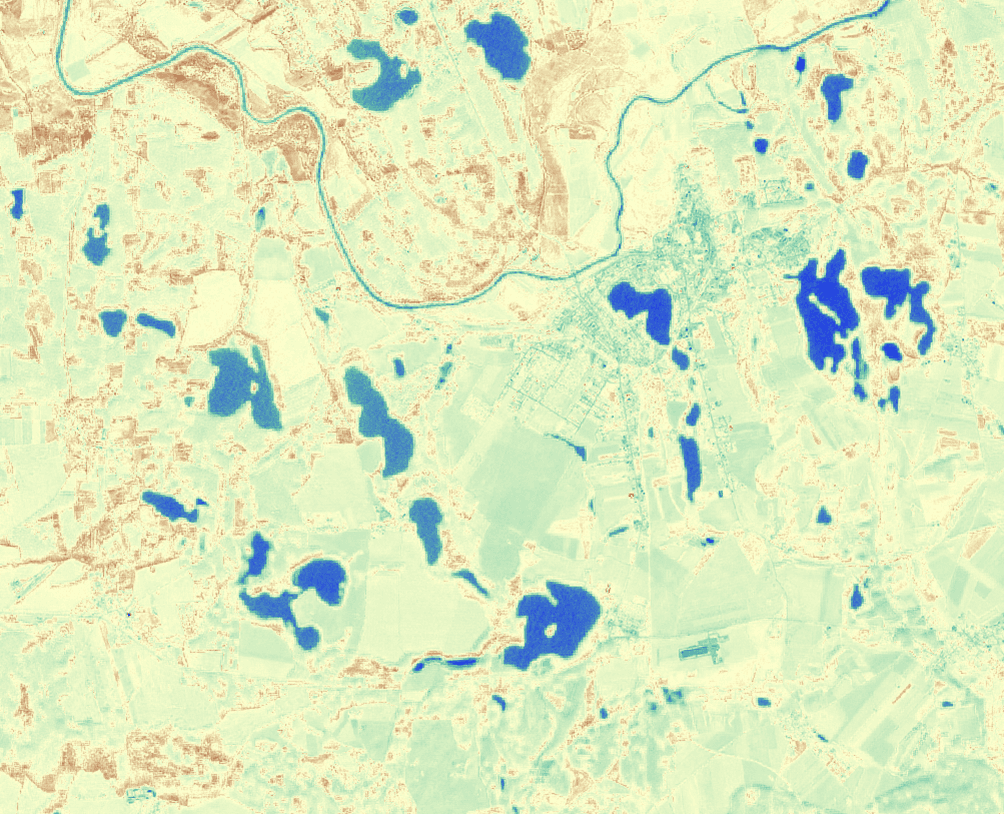
4. NDWI – Normalized Difference Water Index
Application:
- Detection of surface water: Useful for identifying lakes, rivers, and wetlands.
- Monitoring water content in vegetation: Applied in agriculture to manage water resources and monitor crop moisture.
Formula:
NDWI = (NIR − SWIR) / (NIR + SWIR)
5. MNDWI – Modified Normalized Difference Water Index
Application:
- Accurate detection of surface water bodies: Effective for identifying lakes, rivers, flood zones, even in complex urban environments.
- Monitoring water extent changes: Helps track seasonal and sudden changes in water coverage, useful in flood and drought analysis.
- Urban surface analysis: Separates water bodies from urban structures and other artificial surfaces, where traditional NDWI may struggle.
Formula:
MNDWI = (GREEN − SWIR) / (GREEN + SWIR)
6. NDMI – Normalized Difference Moisture Index
Application:
- Monitoring vegetation moisture content: NDMI helps assess water content in plants, relevant for agriculture and crop management.
- Fire risk assessment: Identifies areas more prone to fires due to low vegetation moisture.
Formula:
NDMI = (NIR − SWIR) / (NIR + SWIR)
7. NDSI – Normalized Difference Snow Index
Application:
- Monitoring snow cover: Used to assess snow-covered areas, important in climate change research and glacier monitoring.
- Observing snow cover changes: Tracks seasonal and climate-induced variations in snow coverage.
Formula:
NDSI = (GREEN − SWIR) / (GREEN + SWIR)
8. BSI – Bare Soil Index
Application:
- Soil erosion and land degradation studies: BSI is used in research focused on soil erosion and desertification, especially in agricultural and dry regions.
- Monitoring soil conditions: Tracks changes in soil state in arid regions.
Formula:
BSI = ((SWIR + RED) + (NIR + BLUE)) / ((SWIR + RED) − (NIR + BLUE))
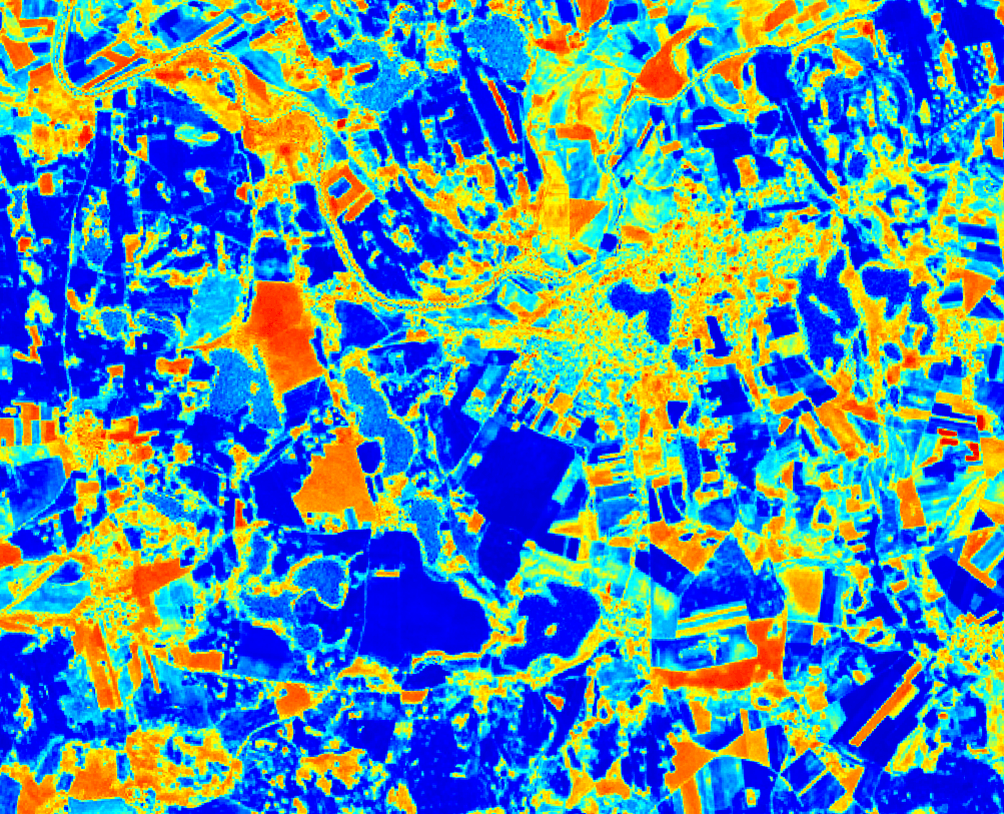
9. MNDBI – Modified Normalized Difference Built-up Index
Application:
- Detection of built-up areas: MNDBI is used to identify and monitor urban zones, effectively distinguishing artificial surfaces like concrete and asphalt from natural terrain.
- Urban development analysis: Helps track city expansion, infrastructure changes, and urban growth over time.
- Spatial planning support: Used by urban planners and analysts to assess urban density and its environmental impact.
Formula:
MNDBI = (SWIR − NIR) / (SWIR + NIR)
10. BAEI – Built-up Area Extraction Index
Application:
- Extraction of built-up surfaces: BAEI is used to identify artificial surfaces such as roads, buildings, and other urban infrastructure, based on the contrast between the blue band and near-infrared.
- Urbanization monitoring: Helps analyze infrastructure development and land cover changes, particularly in rapidly growing cities.
- Separating built-up areas from vegetation and water: BAEI effectively distinguishes artificial surfaces from green areas and water bodies, with high sensitivity in urban environments.
Formula:
BAEI = (RED + SWIR) / (NIR + BLUE)
Comparative table of spectral indices
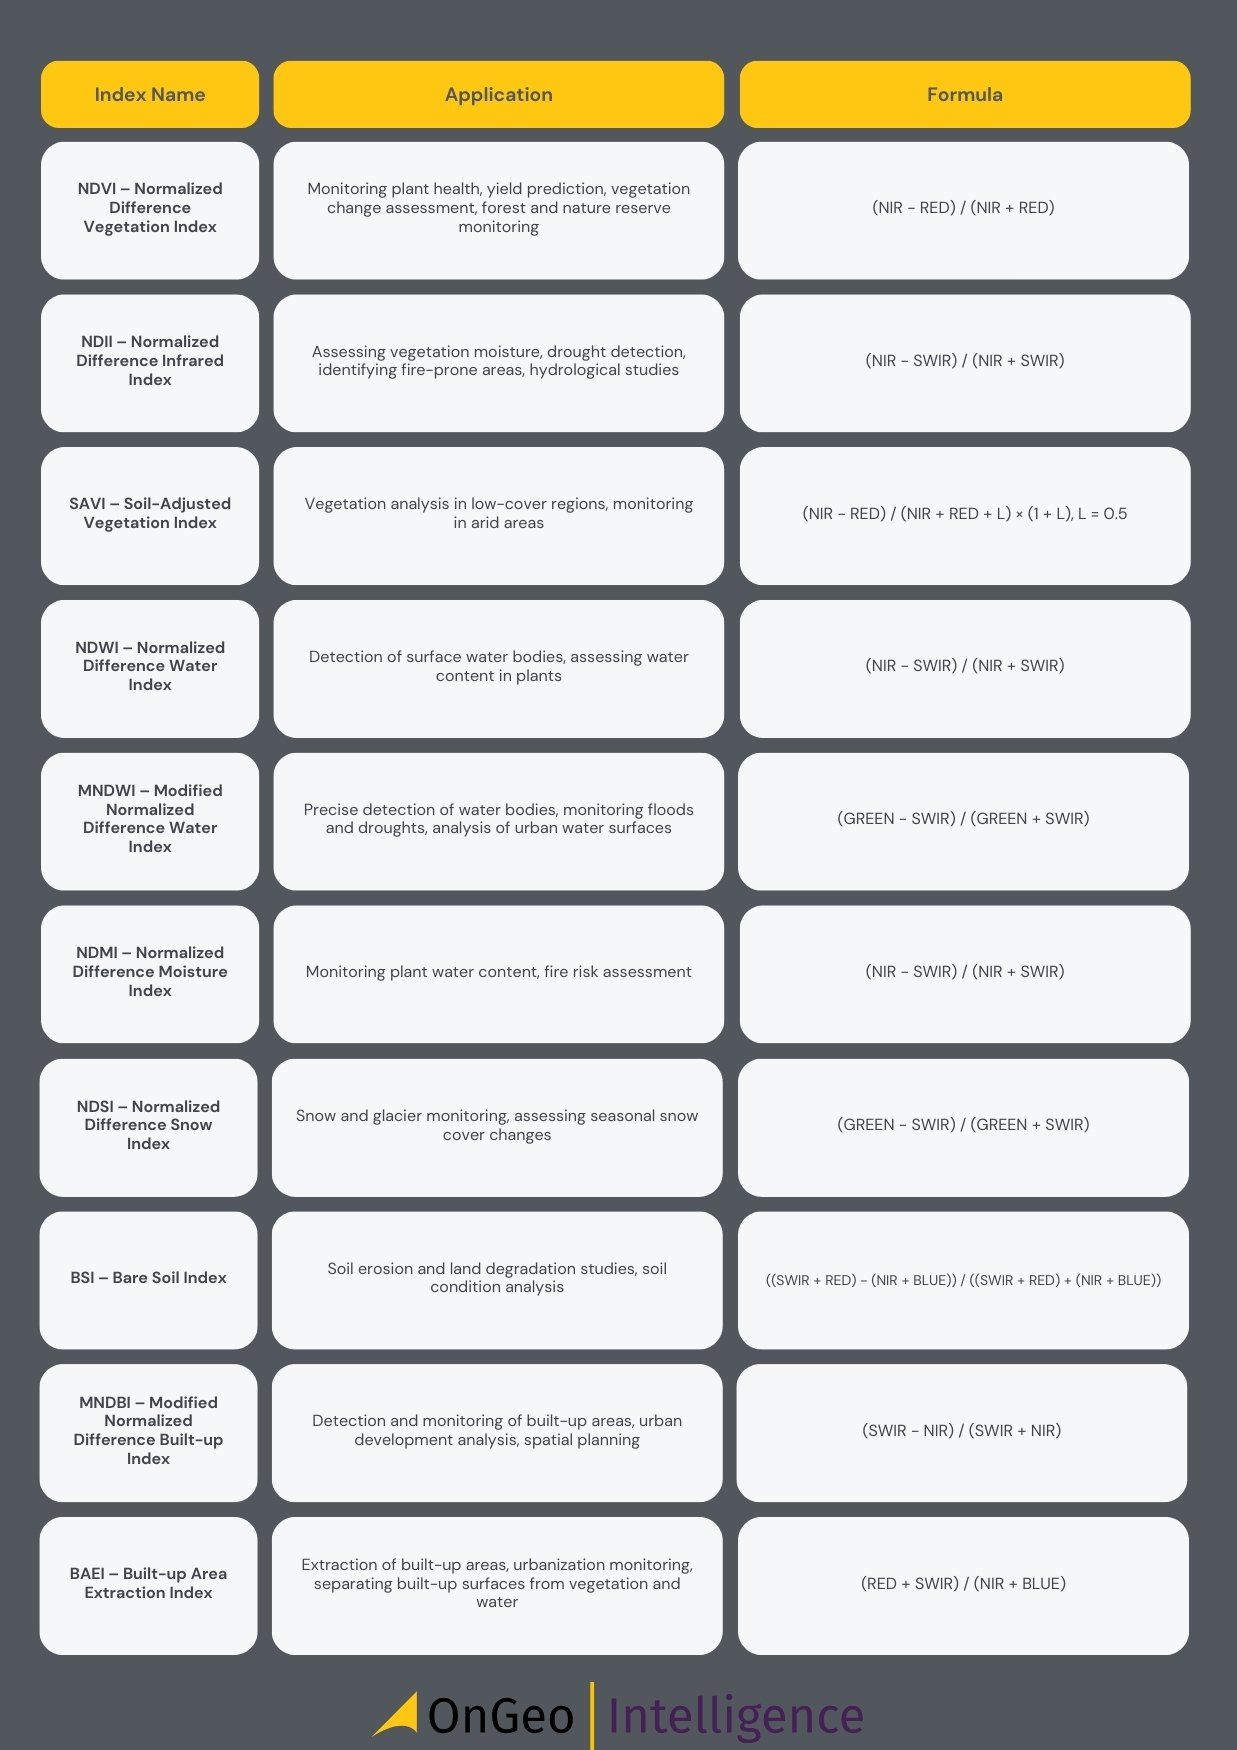
| Index Name | Application | Formula |
|---|---|---|
| NDVI – Normalized Difference Vegetation Index | Monitoring plant health, yield prediction, vegetation change assessment, forest and nature reserve monitoring | (NIR − RED) / (NIR + RED) |
| NDII – Normalized Difference Infrared Index | Assessing vegetation moisture, drought detection, identifying fire-prone areas, hydrological studies | (NIR − SWIR) / (NIR + SWIR) |
| SAVI – Soil-Adjusted Vegetation Index | Vegetation analysis in low-cover regions, monitoring in arid areas | (NIR − RED) / (NIR + RED + L) × (1 + L), L = 0.5 |
| NDWI – Normalized Difference Water Index | Detection of surface water bodies, assessing water content in plants | (NIR − SWIR) / (NIR + SWIR) |
| MNDWI – Modified Normalized Difference Water Index | Precise detection of water bodies, monitoring floods and droughts, analysis of urban water surfaces | (GREEN − SWIR) / (GREEN + SWIR) |
| NDMI – Normalized Difference Moisture Index | Monitoring plant water content, fire risk assessment | (NIR − SWIR) / (NIR + SWIR) |
| NDSI – Normalized Difference Snow Index | Snow and glacier monitoring, assessing seasonal snow cover changes | (GREEN − SWIR) / (GREEN + SWIR) |
| BSI – Bare Soil Index | Soil erosion and land degradation studies, soil condition analysis | ((SWIR + RED) − (NIR + BLUE)) / ((SWIR + RED) + (NIR + BLUE)) |
| MNDBI – Modified Normalized Difference Built-up Index | Detection and monitoring of built-up areas, urban development analysis, spatial planning | (SWIR − NIR) / (SWIR + NIR) |
| BAEI – Built-up Area Extraction Index | Extraction of built-up areas, urbanization monitoring, separating built-up surfaces from vegetation and water | (RED + SWIR) / (NIR + BLUE) |
Spectral Indices are extremely useful tools in remote sensing analysis, enabling precise monitoring of various environmental aspects - from plant health to changes in snow cover. Each Spectral Index has its strengths and limitations, which should be considered when choosing the right one. Understanding these differences allows for the effective use of Spectral Indices depending on the specifics of the project.
If you want to fully harness the potential of satellite data in your analyses, OnGeo Intelligence offers comprehensive solutions for GIS and remote sensing experts.
Contact us to learn how our tools can support your projects!
Why Choose OnGeo Intelligence?
- High-resolution imagery for precise analysis.
- Reliable and verifiable data suitable for court use.
- Comprehensive historical archives to support long-term investigations.