The remote sensing indices NDVI, NDMI, and NDWI
The remote sensing indicators NDVI, NDMI, and NDWI are satellite image processing techniques used to extract and condense thematic information contained in multiple image channels. They help to understand and monitor various aspects of the natural environment, including vegetation quality and quantity, land moisture, and open water presence. It is important to note that these indicators are based on information that is not visible to the human eye, therefore they provide information that is impossible to observe on the ground without specialized instruments. Learn about the differences between these indicators and how they can be used in practice.
Today, observing the Earth from space is becoming accessible to everyone. Ordering a satellite imagery report, which will allow you to interpret changes in the environment and land use on your plot, only takes a few minutes. A series of satellite images, generated in a short time frame, allows for tracking and monitoring changes in vegetation coverage, identifying areas at risk of fire, or indicating fluctuations in water levels in water bodies.
Therefore, satellite images are a common source of knowledge about a particular area, and their popularity is increasing with the improvement of tools for their automatic retrieval and processing.
Remote sensing indicators play a crucial role in monitoring the environment and assessing the state of natural resources. The most valuable indicators include:
- NDVI (Normalized Difference Vegetation Index),
- NDMI (Normalized Difference Moisture Index),
- NDWI (Normalized Difference Water Index).
Below, each of them will be described, as well as the areas in which they are applied.
NDVI Index
The NDVI index is a vegetation difference indicator that uses data from satellite images to assess the density and condition of vegetation. This index also allows for distinguishing vegetation from other artificial land cover types, such as a green surface of an artificial playground or a plastic green tree.
To evaluate the development of vegetation using the NDVI index, the reflection of light beams from the plant surface is analyzed. A healthy plant absorbs red light and reflects near-infrared rays, while a diseased or weak plant has the opposite reaction.
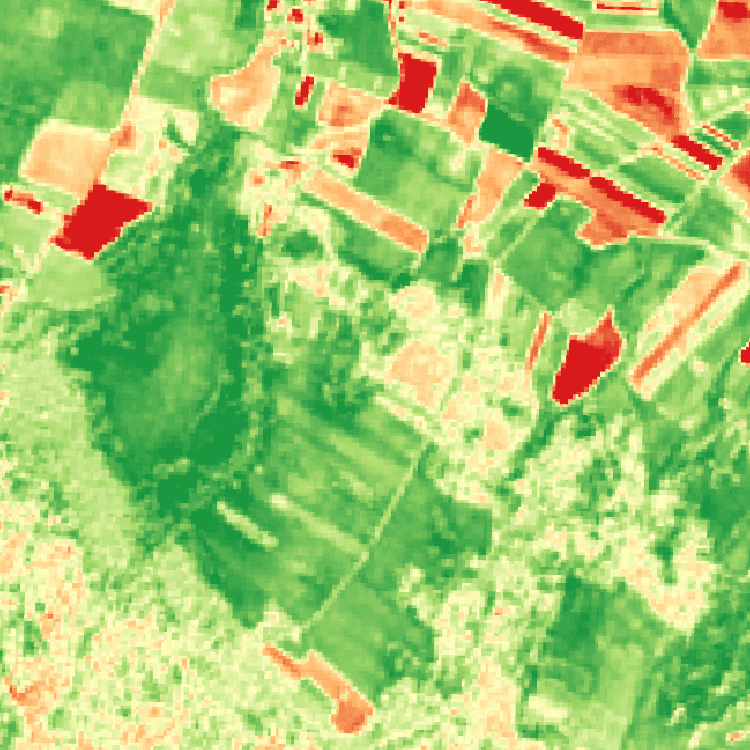
NDVI measures this difference and assigns a score to the plant based on it. The results are presented on a scale from -1 to 1, where values below "0" indicate an area completely devoid of vegetation (red color - see fig.1), and values close to "1" are a hallmark of lush, green vegetation with dense leaves (green color - see fig.1).
We can only speak of good vegetation conditions above ~ 0.4 (white color on fig.1). All lower values indicate dry or poorly developed vegetation. The NDVI index is presented in an arbitrary color scale as a vegetation intensity map.
With NDVI, farmers can monitor their crops, detect plant diseases, and ensure the best possible yields. Foresters can track the health of trees, while scientists study the impact of climate change on vegetation. Changes in NDVI values over time illustrate moments of disease emergence, harvest, or damage to vegetation, as well as the appearance of new plant life.
NDVI is like a magical magnifying glass that allows us to see inside plants and assess their condition from a cosmic perspective.
NDMI Index
The NDMI index is a moisture index that allows for the evaluation of moisture levels in vegetation and soil.
NDMI is based on a comparison of light reflection in two spectral bands - near-infrared (NIR) and short-wave infrared (SWIR).
NDMI is calculated as the ratio of the difference between the reflection values in these two bands to their sum. NDMI values range from -1 to 1. Higher positive values indicate higher moisture content, while lower or negative values indicate lower moisture content.
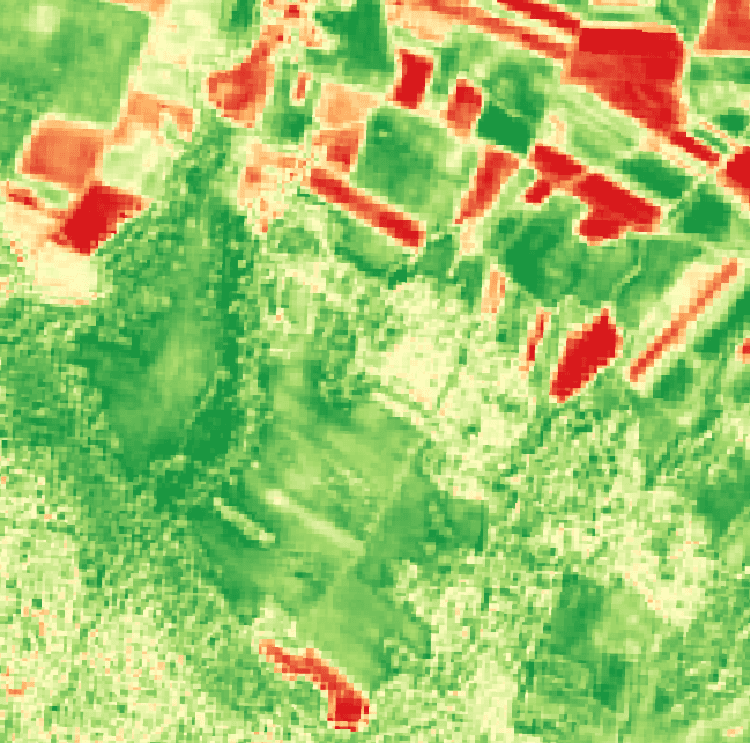
NDMI is commonly used in environmental, agricultural, and forestry monitoring to assess vegetation status, drought conditions, and soil moisture levels. The NDMI index presents a reality beyond the visible light range, which is absolutely inaccessible to the human eye and the natural process of vision.
NDWI Index
The NDWI Index NDWI is a water index that helps assess the area, focusing on the presence and extent of surface water.
NDWI is based on a comparison of light reflection in two spectral bands - green and near-infrared. Surface waters reflect more green light and absorb more near-infrared light. Conversely, vegetation strongly reflects both green light and near-infrared light.
NDWI is calculated as the ratio of the difference between the reflection values in these two bands to their sum. The results are presented on a scale from -1 to 1, where negative values indicate an area covered by vegetation or other land objects (red color - see Rys.3), and a range above "0" indicates the presence of surface water (green color - see Rys.3).
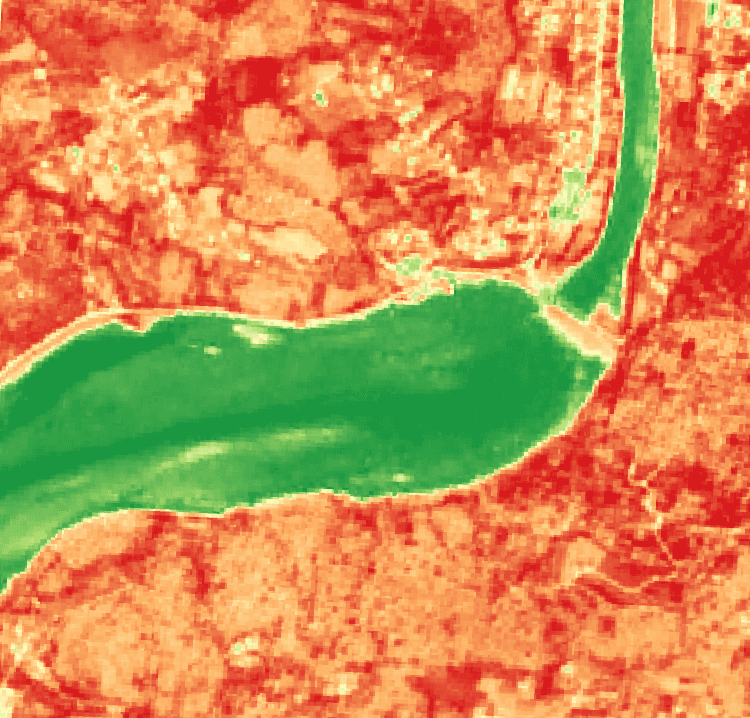
With the NDWI index, we can check the level of wetland and swamp irrigation and also identify and monitor their extent. This information can help develop strategies for protecting these valuable ecosystems and preventing their degradation.
Satellite imaging report and remote sensing indices - download your source of terrain data.
The OnGeo™ Intelligence Advanced Satellite Imaging Report is a collection of intelligently selected satellite images that accurately reflect the area of your plot or selected terrain.
Download exemplary Satellite Imagery Report OnGeo™ Intelligence
The selected satellite images are an invaluable source of information on changes occurring on your plot. With them, you will not only find out how the plot has changed, but you will also verify the changes that have occurred in the selected area due to the effects of natural disasters and other random events, and you will also gain a tool for analyzing production processes on the plot.
OnGeo™ Intelligence reports can also be an excellent source of data for analyzing crop damage. Thanks to them, you don't have to worry about where to get data to calculate remote sensing indices, including NDVI, NDMI, and NDWI. You will receive ready-made, processed data in just a few minutes.
Satellite imaging data is available in two forms - in the form of a user-friendly PDF document and in the form of a Sentinel-2 data package, where you will find files ready to be included in a GIS-type program.
How to generate a Satellite Imagery Report?
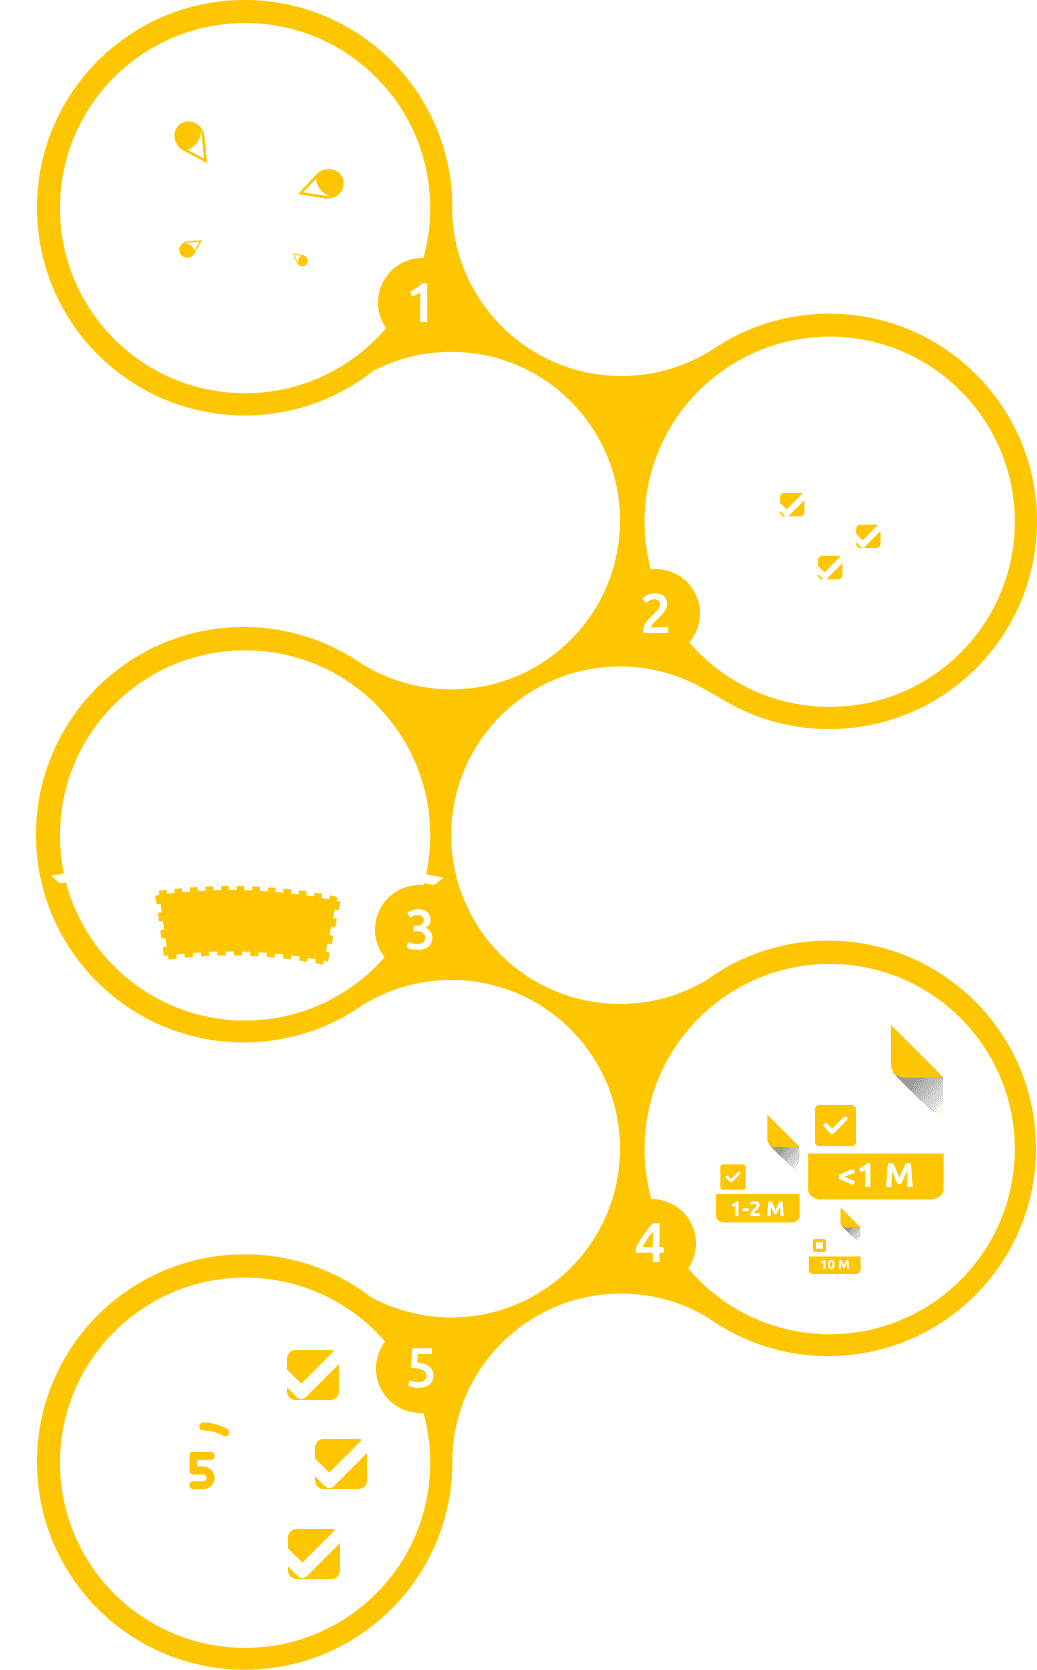
Creating a Report with satellite images on OnGeo™ Intelligence is straightforward and involves just a few steps:
Related articles
- Satellite Imagery Report - generate it yourself
- Real-Time Satellite Imagery
- What Is Location Intelligence? A Guide for Modern Businesses
- Satellite Imagery Archives: How to Access Historical Satellite Images
- Near Infrared (NIR): A Key to Vegetation Monitoring
- A List of Earth Observation Satellites & Optical Parameters
- Spectral Bands: A Guide to Popular Index Formulas