
How to Master Satellite Image Analysis: A Beginner's Step-by-Step Guide
Did you know that images from the Sentinel-2 mission take pictures of the Earth at a resolution of 10 m/pixel, while state-of-the-art commercial satellites are capable of providing images as detailed as 30 cm/pixel?
This striking difference in resolution highlights why satellite image analysis is both fascinating and complex. When looking at satellite imagery, we're essentially viewing Earth from above, however, interpreting what we see requires specific knowledge and techniques.
Whether we're examining images that cover an entire hemisphere at once or focusing on detailed landscape-scale imagery, mastering the interpretation of these visual representations requires a systematic approach. In this step-by-step guide, we'll walk through everything you need to know to start analyzing satellite imagery effectively.
Let's begin with understanding the basics.
Understand the Basics of Satellite Imagery
Satellite imagery represents the visual data collected by imaging satellites as they orbit Earth. These powerful tools provide us with a unique perspective for monitoring our planet's surface and atmosphere.
What is satellite imagery and how is it captured?
Satellite images are collected by imaging satellites operated by governments and businesses worldwide. The journey began with the first orbital photographs of Earth taken on August 14, 1959, by the U.S. Explorer 6. Modern satellites capture information through specialized sensors that detect electromagnetic radiation at various wavelengths, including visible light, near-infrared, infrared, and radar.
These sensors convert energy into digital data by assigning numeric values to each pixel based on the amount of light detected. The information is transmitted to ground stations as binary code, which computers then translate into imagery. Each pixel in a satellite image represents the relative reflected or emitted light energy recorded for a specific area on Earth.
Types of satellite sensors and resolutions
Satellite imagery comes in various resolutions that determine the level of detail visible in images:
- Spatial resolution: Defines the pixel size representing an area on the ground. For example, GeoEye 1 has a ground sample distance (GSD) of 0.41m, meaning each pixel covers a 41cm x 41cm area.
- Spectral resolution: Refers to the wavelength interval size and number of bands the sensor measures. Landsat 8 contains 11 spectral bands, each highlighting different landscape features.
- Temporal resolution: The time between imagery collection periods for a given location.
- Radiometric resolution: The number of brightness levels the sensor can distinguish, it is measured by the number of shades of grey. The maximum number of shades that can be recorded is determined by the number of bits (binary values). For example, 8-bit imaging has 256 shades of grey.
Learn to Read Visual Elements in Images
Interpreting satellite imagery requires training your eyes to recognize key visual elements that reveal crucial information about Earth's surface features.
Identifying patterns, shapes, and textures
Pattern recognition forms the foundation of effective satellite image analysis. Human-made features typically display geometric patterns—farms appear as neat rectangles or circles, urban areas show grid-like street patterns, and roads cut straight lines across landscapes. In contrast, natural features exhibit more irregular patterns—rivers twist and turn, forests have uneven edges, and coastlines follow irregular contours.
Texture represents the frequency of tone changes within an image, indicating surface roughness or smoothness. Rough textures appear mottled with abrupt gray level changes in small areas, while smooth textures show minimal tonal variation. Forests display rough textures due to their complex canopy structure, whereas agricultural fields and water bodies typically present smoother textures.
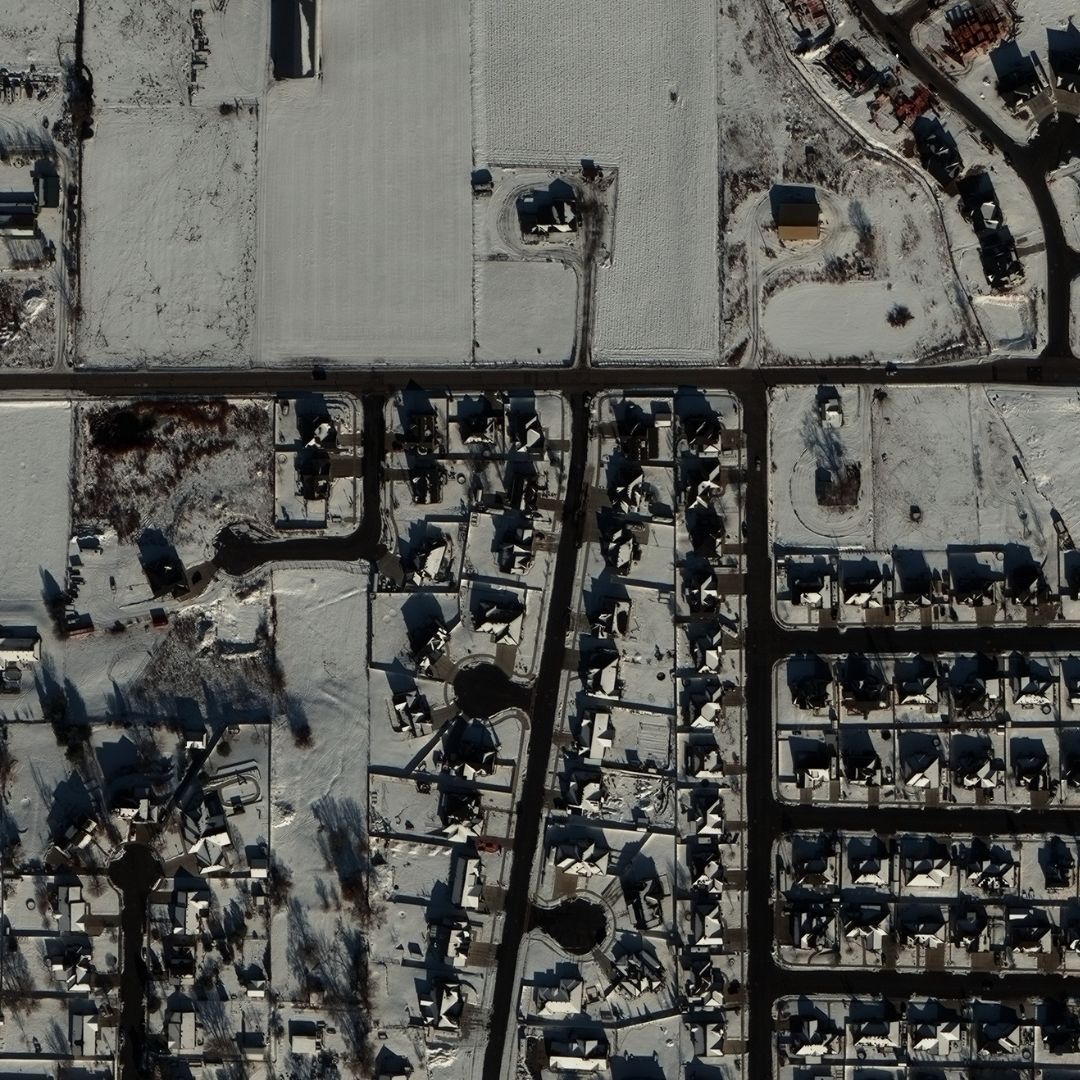
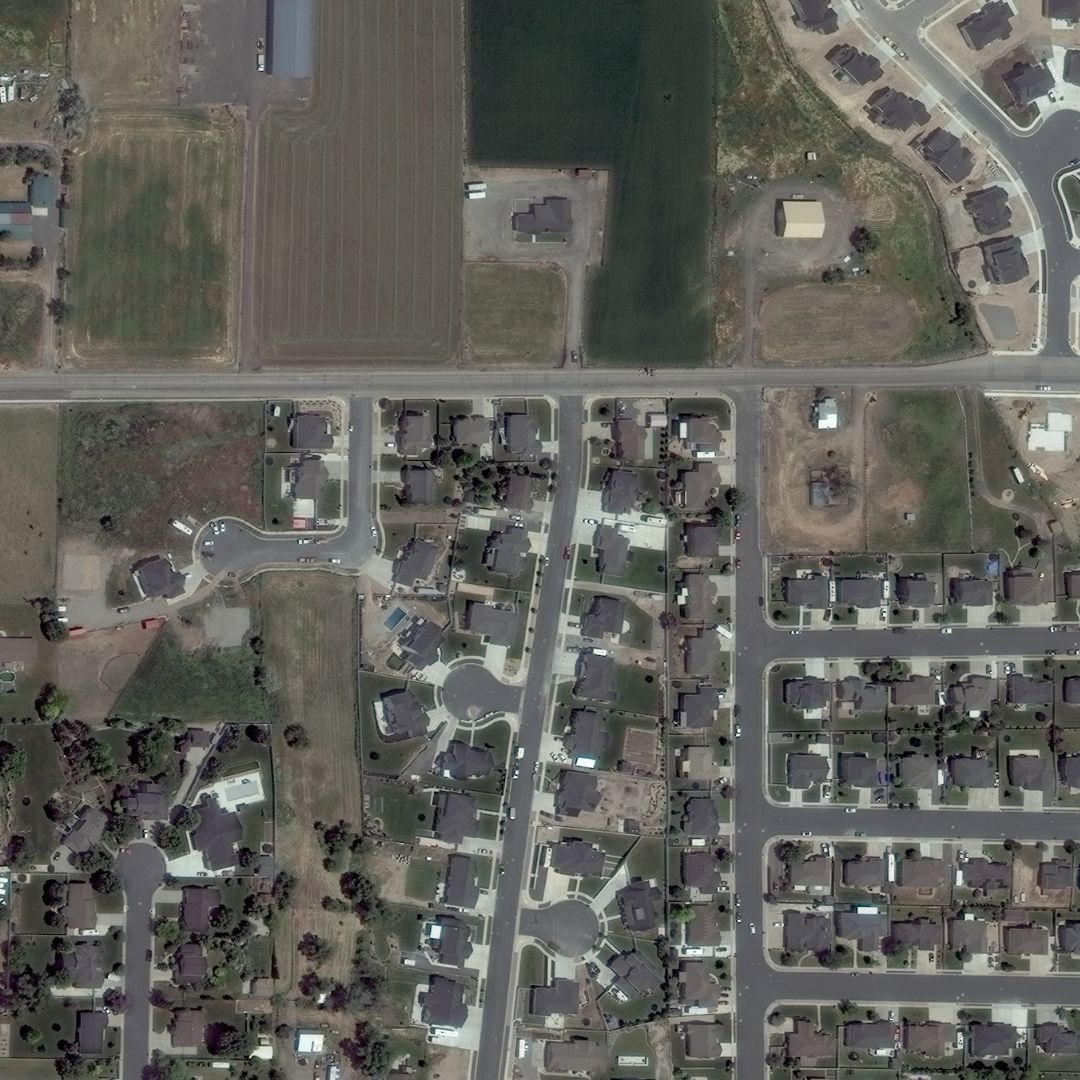
Examples of OnGeo Intelligence satellite imagery of the same area in winter in January and in spring in May.
Understanding color tones and shadows
Colors in satellite imagery provide vital clues about surface features:
- Water bodies typically appear black or dark blue as they absorb light. Sediment-rich water looks brown, gradually changing to green and blue as sediment disperses.
- Vegetation ranges from pale green (grasslands) to dark green (forests). In false-color imagery, healthy vegetation often appears bright red due to strong infrared reflection.
- Bare ground usually shows as brown or tan, varying based on mineral content.
- Urban areas generally appear silver or gray from concrete and building materials.
Shadows reveal object height and structure but can also create interpretation challenges. At times, shadows cause an optical illusion called "relief inversion," where valleys appear as mountains. This occurs because we expect images to be lit from the top-left corner. Additionally, shadows can make distinguishing between water bodies and shadowed areas difficult, as they share similar characteristics.
Using scale and orientation effectively
Before interpreting any satellite image, identify its scale to understand what level of detail it contains. Furthermore, determining the image's orientation helps match features to maps. Finding north allows you to correctly identify if a mountain range runs north-south or east-west, or whether a city lies east or west of a river.
Explore Different Types of Satellite Imagery
Beyond basic visual interpretation, different types of satellite imagery provide specialized insights through various spectral combinations and analytical techniques.
True color vs. false color imagery
True color imagery combines actual measurements of red, green, and blue light, producing images that resemble what the human eye naturally sees. Vegetation appears green, water appears dark blue to black, and bare ground looks light gray or brown. Although intuitive, these images often suffer from low contrast and atmospheric haze.
Unlike true color, false color imagery uses at least one non-visible wavelength band. A common combination displays near-infrared as red, red as green, and green as blue. Consequently, healthy vegetation appears bright red since plants strongly reflect near-infrared light. This makes false color particularly valuable for vegetation assessment, as vigorously growing plants appear as intense reds, while less vigorous vegetation shows as lighter reds or pinks.
Scene classification techniques
Scene classification automatically categorizes satellite imagery into meaningful classes like urban areas, forests, or agricultural land. Modern approaches utilize deep learning methods, particularly Convolutional Neural Networks (CNNs). These systems analyze multi-resolution feature maps to handle variations in remote sensing datasets.
Advanced techniques integrate channel-spatial attention mechanisms with transformer models, capturing both local details and long-range dependencies crucial for high-resolution image analysis. Hence, scene classification enables efficient large-scale environmental monitoring and urban planning applications.
Apply Tools and Context for Deeper Analysis
Moving beyond basic interpretation requires specialized tools and contextual knowledge that transform raw satellite data into actionable insights.
Incorporating prior knowledge and maps
Perhaps the most powerful tool for interpreting satellite imagery is knowledge of the place. When analyzing an area you're familiar with, identification becomes significantly easier. For instance, if you know a wildfire occurred in a forest last year, you can confidently identify a dark brown patch as a burn scar rather than mistaking it for a volcanic flow or shadow.
Local knowledge connects satellite mapping to real-world contexts across disciplines—from economics and history to geology, biology, and health. If you lack familiarity with an area, reference maps and atlases become extremely valuable resources. They provide names for visible features, enabling further research. Many online mapping services offer labeled satellite views, while historical maps help identify changes and understand why they occurred.
Mastering Satellite Imagery: Your Journey Forward
Satellite image analysis offers remarkable opportunities for both professionals and enthusiasts alike. Throughout this guide, we've explored the fundamental building blocks needed to interpret Earth from above effectively.
Understanding basic satellite principles certainly provides the foundation for all analysis work. The differences between active and passive sensors, alongside various resolution types, shape how we perceive and process these valuable images. Additionally, learning to recognize visual elements transforms abstract pixels into meaningful information about our world.