
Borders You Can See From Space: How Satellite Imagery Reveals the Line Between Nations
Political borders are, in theory, invisible lines drawn on maps arbitrary constructs with no physical presence on the ground. Yet when you look down at Earth from orbit, some of these lines turn out to be startlingly real. Decades of different land-use policy, agricultural practice, energy infrastructure, and urban planning on either side of a border can reshape the landscape so dramatically that the frontier becomes a visible seam, even without any marker, fence, or wall.
At Ongeo Intelligence we work with satellite imagery every day, and one of the things that never stops being fascinating is how clearly a country's economic and political choices show up from space. Below are borders where the imagery tells its own story and where, using current satellite data, that story is just as striking as ever.

Border United States and Mexico
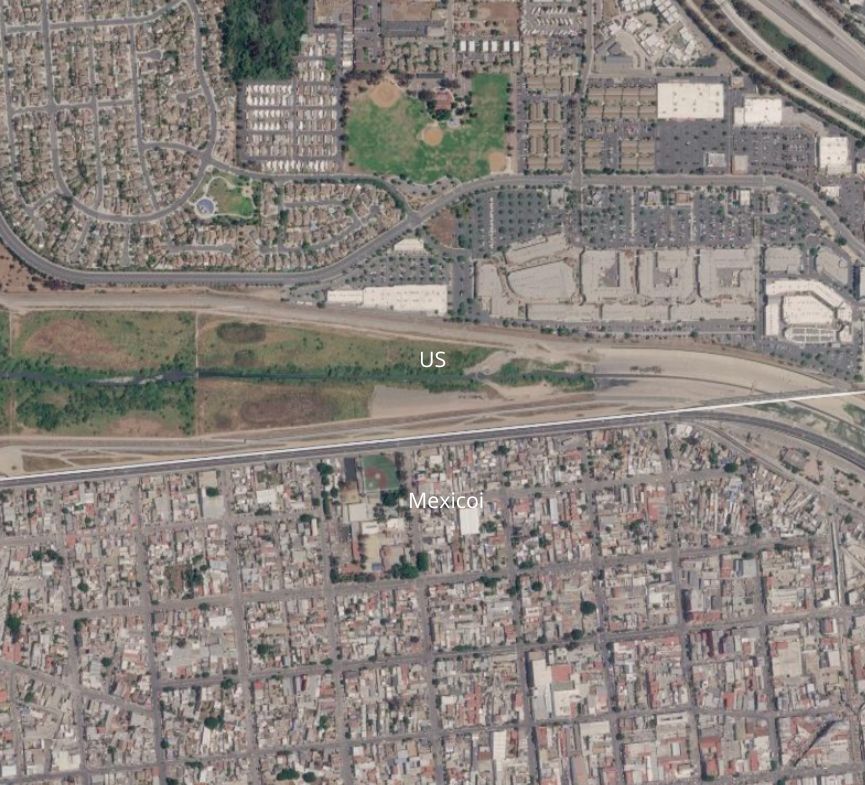
This close-up view along the San Diego–Tijuana border shows one of the sharpest urban contrasts anywhere on Earth. On the US side, the layout is unmistakably suburban: curving residential streets, a landscaped park with a baseball diamond, and a shopping center with wide, orderly parking lots, all separated from the border itself by an open buffer of scrubland. Cross the line marked by a thin diagonal road running along the fence and the pattern changes instantly. Tijuana's grid tightens into dense city blocks, buildings pack right up against the street, and the open buffer disappears entirely. There is no gradual transition here; the change in urban density happens in the space of a single frame.
Border China, Kazakhstan, and Russia
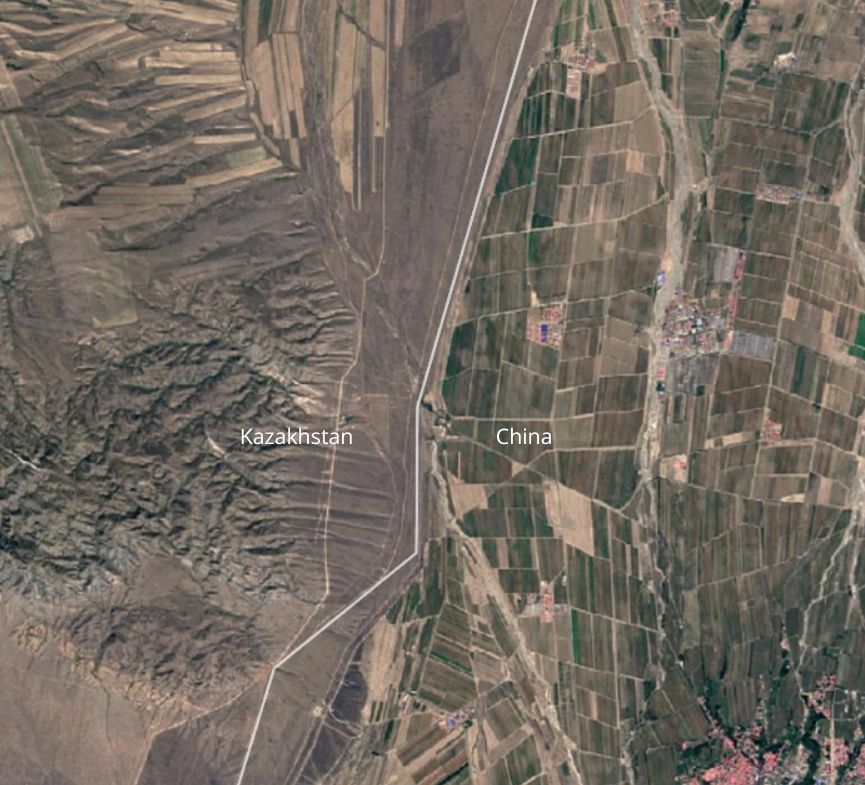
A striking agricultural border appears between northwestern China (near Qoqek/Tacheng) and eastern Kazakhstan. Current satellite imagery shows intensive irrigated farming on the Chinese side, where arid land is turned into dark green fields wherever possible. China maximizes production on limited arable land through heavy investment in irrigation.
On the Kazakh side, the landscape remains far less intensively cultivated. Eastern Kazakhstan is not a primary agricultural zone; farming relies more on rainfall with limited permanent irrigation. Fields appear tan or sparsely developed and blend into the natural arid surroundings. The political boundary thus forms a sharp visual divide in vegetation and land-use intensity.
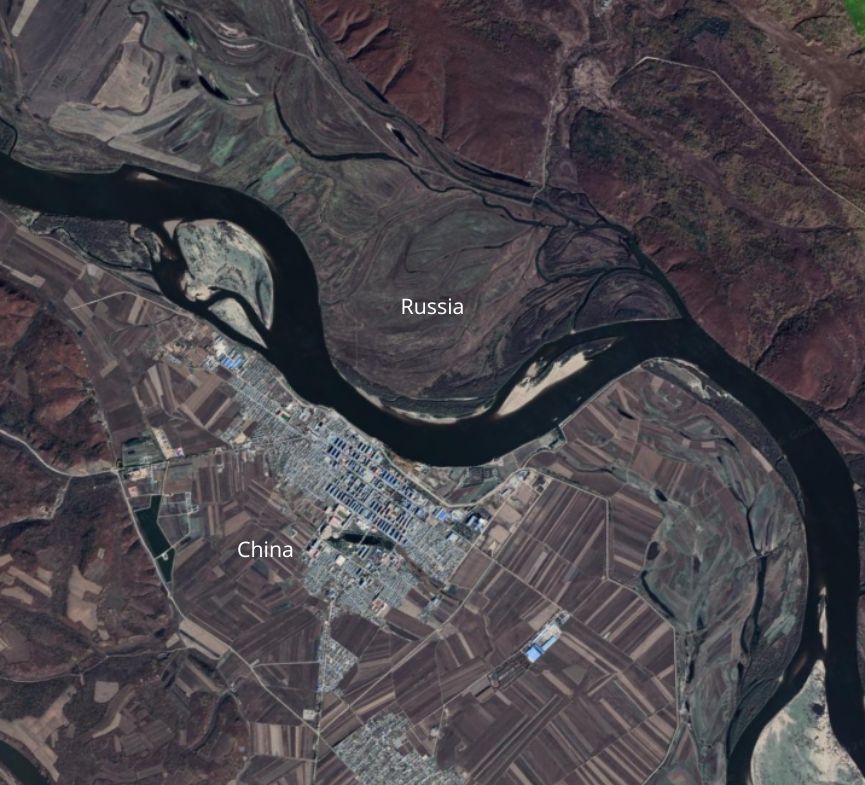
Along the Amur–Heilong River, which forms much of the China–Russia border in this region, the river itself does a lot of the dividing but the land use on either bank tells the rest of the story. The Chinese side is densely packed with a grid of small agricultural plots and a compact town built right up to the riverbank. Across the water, the Russian side is largely undeveloped: a wide, meandering floodplain with wetland patterns and almost no visible settlement or cultivation. It's a striking illustration of how China's intensive use of every available hectare contrasts with the far lower population density and agricultural pressure across much of Russia's eastern frontier.
Border South Korea and North Korea
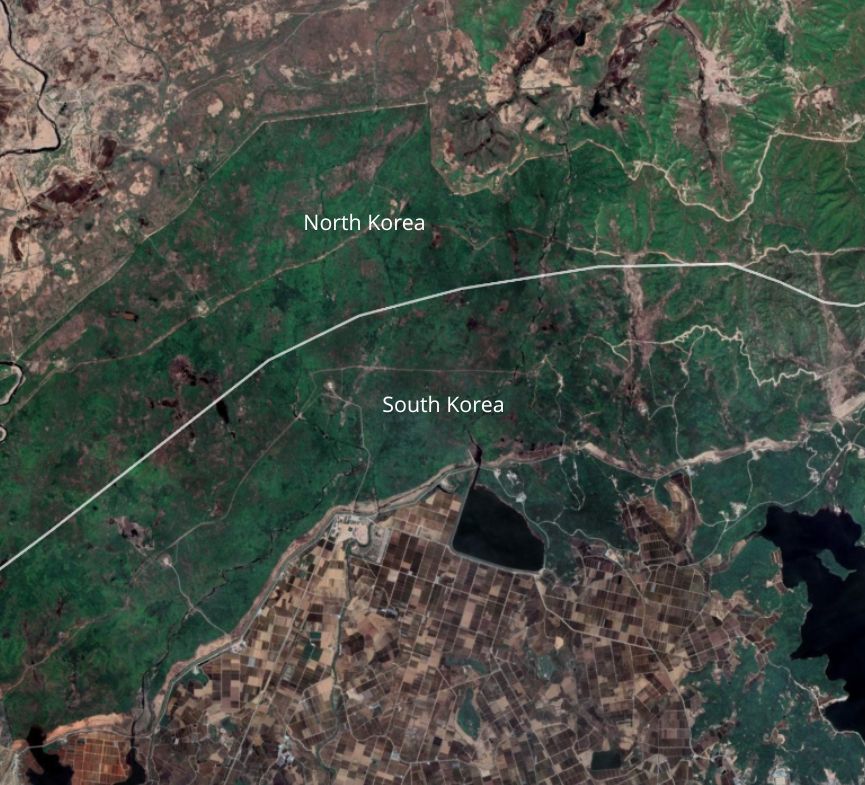
This section of the inter-Korean border, just south of the Demilitarized Zone, tells a more nuanced story than the "North Korea is dark and bare" stereotype often suggests. In this particular stretch, the terrain on both sides is forested and mountainous, with North Korea's hills showing patchy, mixed-density tree cover. What changes is what happens once the land flattens out: on the South Korean side, the forest gives way to a tightly organized checkerboard of agricultural fields and a large reservoir, evidence of intensive land management and irrigation infrastructure. It's a reminder that border contrasts aren't always about one side being "green" and the other "brown" sometimes it's about how deliberately the usable land is organized once you cross the line.
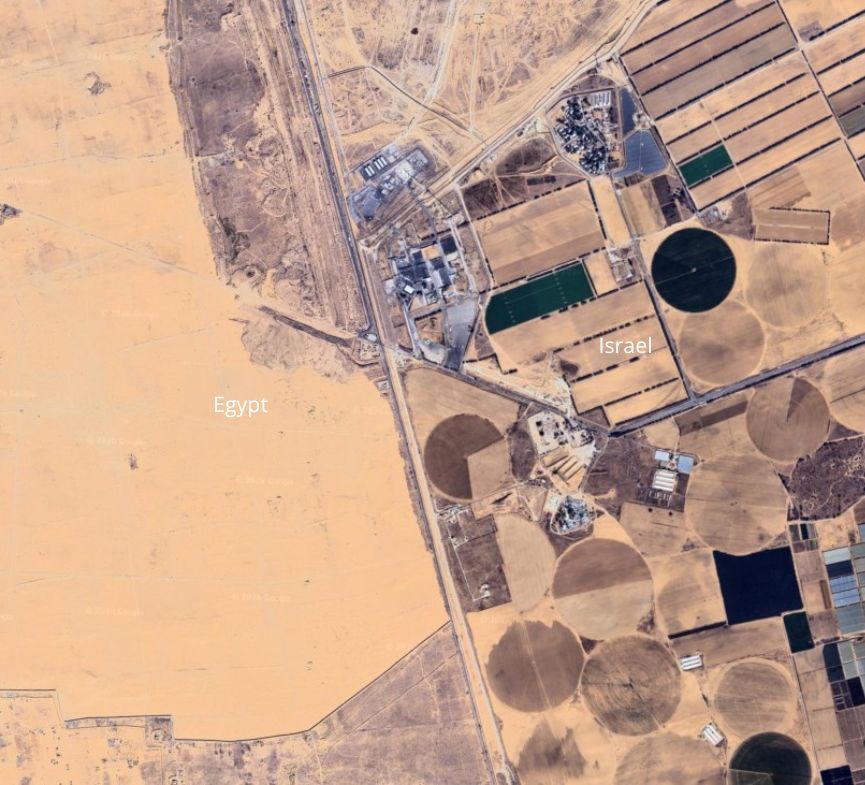
Border Israel and Egypt
This view centers on the Kerem Shalom crossing, the point where the Israeli, Egyptian, and Gaza borders converge in the northeastern Sinai/western Negev. The contrast here is almost a straight line: to the west, on the Egyptian side, the land is a uniform expanse of pale desert sand with no visible cultivation. Cross the marked border road eastward and the landscape changes immediately Israeli agricultural communities such as Kerem Shalom and Amitai appear as clusters of neat rectangular fields and greenhouses, with the distinctive dark circles of center-pivot irrigation systems scattered among them. Even the color of the ground shifts, from bare tan sand to the deeper, cultivated tones of irrigated soil. Unlike some other borders on this list, this one isn't just about vegetation cover; it reflects a fundamental difference in how each side has chosen to develop and irrigate marginal desert land right up to the boundary itself.
Why These Borders Matter in Current Satellite Analysis
These cases show that satellite imagery does more than record political geography. It captures the cumulative effects of policy, economics, technology, and resource management. Intensive irrigation, reliable electricity grids, and differing approaches to land stewardship leave lasting signatures that today’s sensors detect both day and night.
Modern platforms make such comparisons straightforward. Current optical data from Landsat 8/9 and Sentinel-2, radar from Sentinel-1, and nighttime lights from VIIRS allow analysts to examine these contrasts in near-real time. High-resolution commercial imagery adds further detail on infrastructure and urban form. Tools that combine multi-temporal archives with analysis capabilities enable users to view any of these borders with the latest 2025–2026 acquisitions and monitor ongoing change.
Borders that appear invisible on a political map become unmistakable when viewed through the consistent, objective lens of Earth observation. In an era of abundant current satellite data, these visual divides continue to offer clear evidence of how human decisions reshape the planet right up to the edge of a neighboring country.
OnGeo Intelligence Satellite Imagery Report
At Ongeo Intelligence, we make this kind of imagery available to anyone, not just governments and research institutions. Through our Satellite Imagery Report service, you can order high-resolution images of any location on Earth your own plot, a border region, or anywhere else you're curious about with no registration, no subscription, and no GIS experience required. Just pick a location and time period, and within minutes you'll have a downloadable report with clear, up-to-date satellite views, plus a free tier for lower-resolution imagery. Explore satellite imagery of any location and see for yourself what's visible from space.
Free satellite imagery reports
Use the code ongeo100 to download a free OnGeo Intelligence Satellite Imagery Report with low-resolution images 10m.
Seeing It for Yourself
What makes this kind of comparison so compelling today is how much satellite imagery has improved. Current-generation Earth observation satellites provide resolution and revisit rates that make it possible to track these border contrasts in near real time not just as historical curiosities from archived imagery, but as an ongoing record of how national policy continues to reshape the land, one growing season and one power grid at a time.
Related articles
- Discovering the Past from Space: How Satellite Remote Sensing Is Transforming Archaeology?
- The best satellite imagery providers: a comparison guide
- How Often Do satelites Take Pictures? Satellite Imagery Frequency
- How to Find & Order Satellite Images with Ongeo Intelligence?
- How to get a historical satellite map of my property
- Satellite Imagery Reveals the Full Scale of Western Europe’s Most Destructive Wildfires in Decades