Satellite Imagery for Agriculture: Crop Monitoring Guide
Agriculture is becoming increasingly data-driven. With larger farm operations and more unpredictable climate conditions, timely insight into crop health is essential. Satellite imagery enables remote, consistent monitoring of fields, while vegetation indices such as NDVI turn this data into actionable information for tracking crop development and detecting stress. Today, satellite data is a key tool for informed decision-making in modern agriculture.
How Satellite Imagery Is Used in Agriculture
Satellite imagery enables continuous monitoring of agricultural land by capturing reflected energy from crops across different wavelengths of the electromagnetic spectrum. Healthy vegetation reflects near-infrared (NIR) light strongly while absorbing visible red light, a contrast that allows analysts to assess plant health from space.
In agriculture, satellite imagery is commonly used to:
Monitor Crop Health
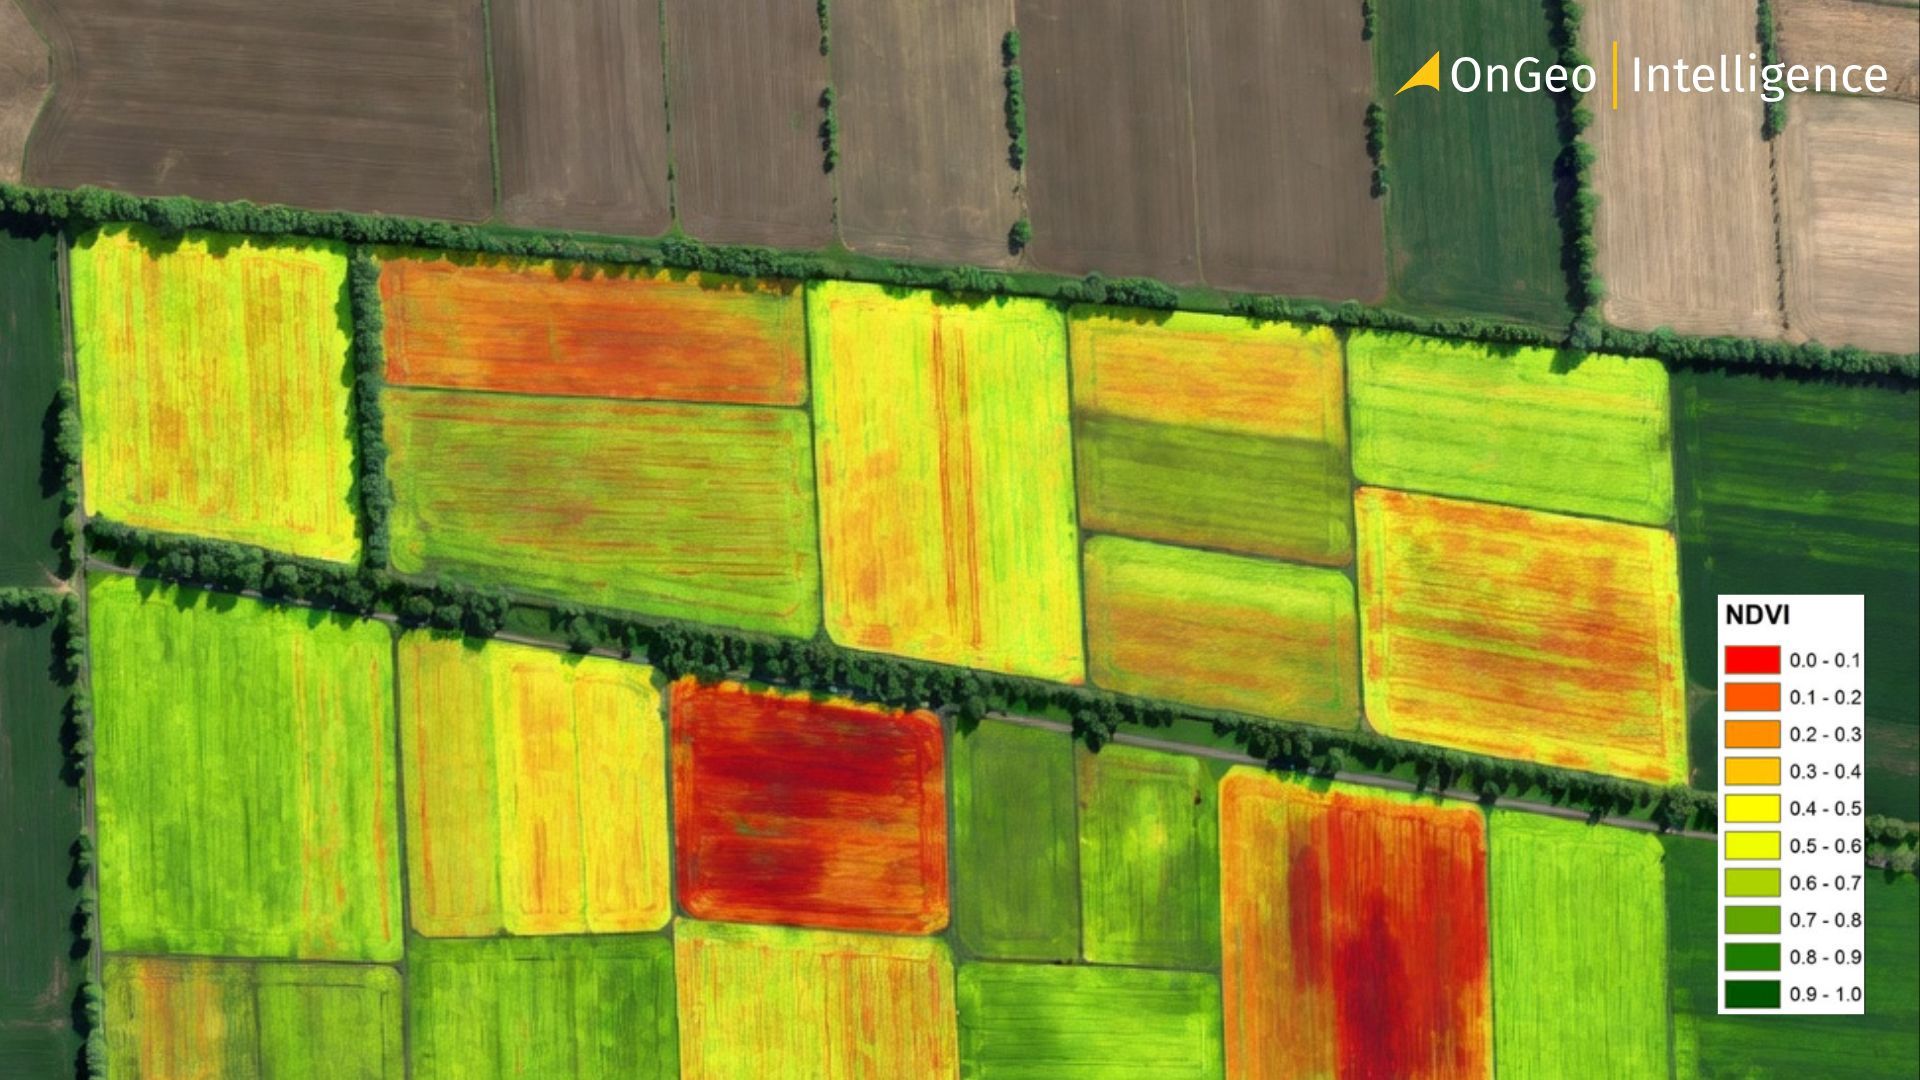
By analyzing vegetation indices such as NDVI, satellite data helps identify healthy crops, stressed areas, and uneven growth patterns across fields. This allows early detection of issues related to drought, nutrient deficiencies, pests, or disease often before symptoms are visible on the ground.
Track Crop Growth Over Time
Satellites revisit the same areas regularly, making it possible to track crop development from planting through harvest. Time-series imagery helps farmers understand growth trends, compare seasonal performance, and identify delayed or abnormal crop development.
Optimize Irrigation and Resource Use
Satellite-based moisture and vegetation analysis supports efficient irrigation planning by highlighting areas experiencing water stress. This reduces overwatering, conserves resources, and lowers operational costs.
Support Precision Agriculture
Satellite imagery allows fields to be divided into management zones based on crop condition. Farmers can apply fertilizers, pesticides, and water only where needed, improving yields while minimizing environmental impact.
Estimate Yields and Support Planning
By analyzing vegetation trends throughout the growing season, satellite imagery contributes to yield estimation and food production forecasting. These insights support farm-level planning as well as regional and national food security assessments.
Overall, satellite imagery transforms agriculture from reactive field inspections to proactive, data-driven management enabling more resilient and sustainable farming practices.
Key Crop Health Monitoring Techniques
Satellite imagery supports crop monitoring by converting raw spectral data into clear indicators of plant condition. These techniques help identify stress, growth patterns, and productivity across agricultural fields at different scales.
1. Vegetation Indices (NDVI and Beyond)
Vegetation indices are mathematical combinations of satellite bands designed to highlight plant health. The most widely used index is the Normalized Difference Vegetation Index (NDVI):
NDVI = (NIR − Red) / (NIR + Red)
- Values close to +1 indicate dense, healthy vegetation
- Values near 0 represent bare soil or sparse crops
- Negative values usually indicate water, clouds, or non-vegetated surfaces
NDVI is commonly derived from Sentinel-2, Landsat, and MODIS imagery and is widely used for monitoring crop vigor, drought stress, and seasonal growth trends.
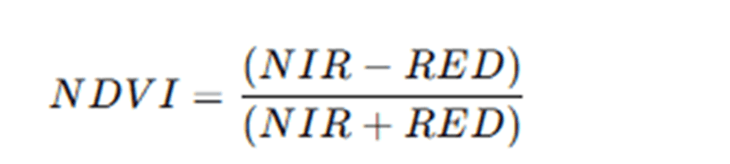
NIR – reflectance in the near-infrared band
RED – reflectance in the red band
Range: −1 to +1
Values close to +1 → dense vegetation
Values near 0 → bare soil or urban areas
Values below 0 → water or snow
Used with: Landsat (Band 5 & Band 4), Sentinel-2 (Band 8 & Band 4), MODIS
Other important indices include:
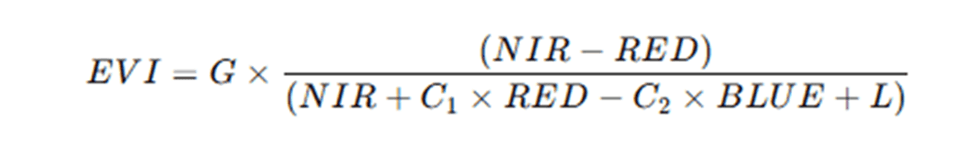
- EVI (Enhanced Vegetation Index) – better performance in dense vegetation

- NDWI (Normalized Difference Water Index) – useful for detecting water stress
- SAVI (Soil-Adjusted Vegetation Index) – reduces soil brightness effects in early growth stages
2. Time-Series Analysis
Rather than analyzing a single image, satellite data is often examined over time. By comparing imagery from multiple dates, analysts can:
- Track crop development stages
- Detect sudden declines in vegetation health
- Compare current season performance with previous years
- Identify persistent problem areas within fields
Time-series analysis is especially valuable for early warning and long-term agricultural planning.
3. Change Detection
Change detection techniques highlight differences between images captured at different times. In agriculture, this helps identify:
- Areas affected by drought or flooding
- Damage from pests or disease outbreaks
- Harvested vs. unharvested fields
- Unexpected land-use changes
This method provides objective evidence to support farm management decisions and compliance monitoring.
4. Field Zoning and Variability Mapping
Satellite imagery reveals variability within fields that may not be visible on the ground. By dividing fields into zones based on crop condition, farmers can implement targeted interventions such as variable-rate fertilization or irrigation.
These crop health monitoring techniques turn satellite imagery into actionable agricultural intelligence supporting higher yields, reduced costs, and more sustainable farming practices.
Satellite Indices Analysis in an OnGeo Intelligence Report
OnGeo Intelligence report demonstrates how satellite data can be used to assess crop condition and environmental stress over time. By combining key indices such as NDVI, NDMI, and NDWI, the report provides a clear, data-driven overview of vegetation health and moisture conditions without the need for field inspections.
NDVI – Normalized Difference Vegetation Index
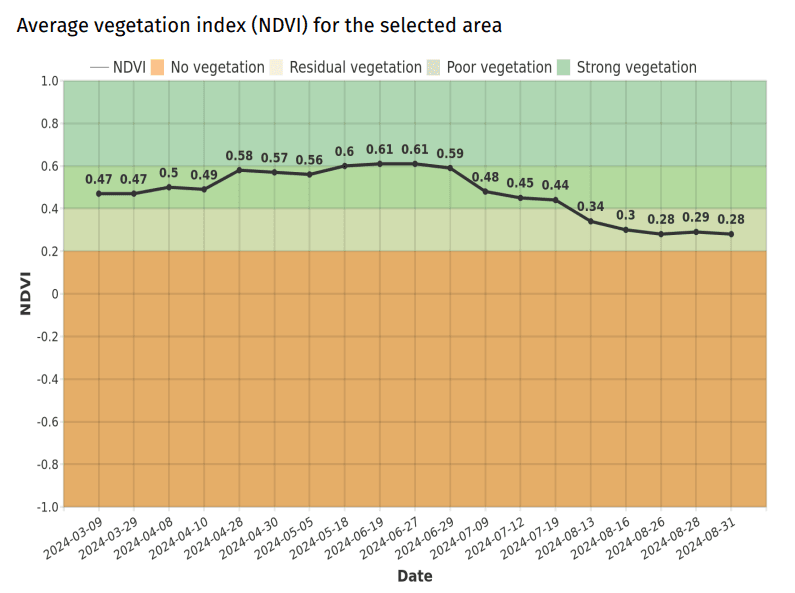
What it measures:
Vegetation health and density by comparing near-infrared (NIR) light, which healthy plants strongly reflect, with red light, which plants absorb during photosynthesis.
What NDVI tells farmers:
NDVI provides an overview of crop vigor, helps identify areas affected by nutrient deficiencies, pests, or disease, and supports tracking crop growth stages over time. Higher NDVI values generally indicate healthier vegetation.
NDMI – Normalized Difference Moisture Index
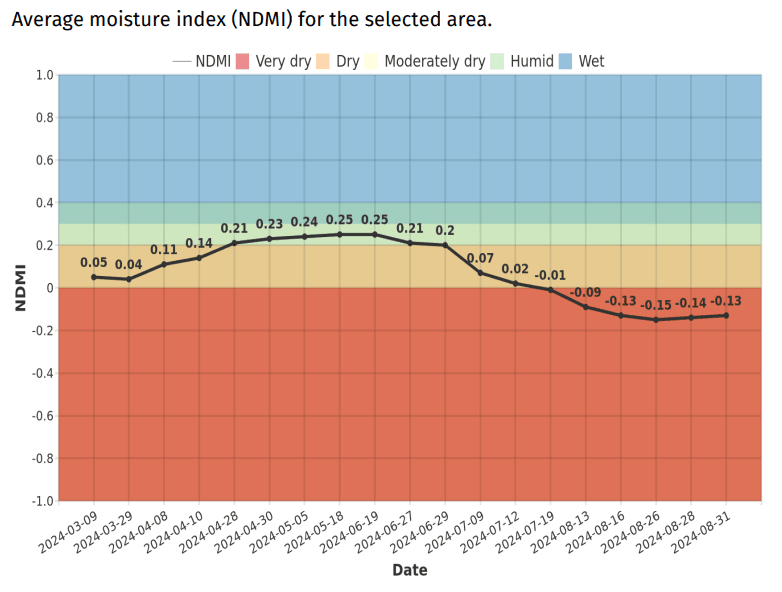
What it measures:
Water content within plant leaves using near-infrared (NIR) and short-wave infrared (SWIR) light.
What NDMI tells farmers:
NDMI helps detect water stress before visible symptoms appear, supporting efficient irrigation planning and better water resource management.
NDWI – Normalized Difference Water Index
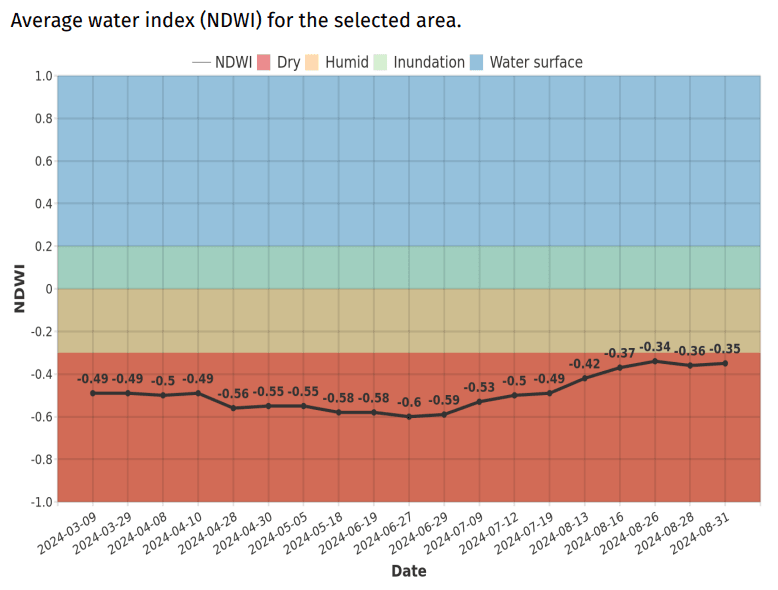
What it measures:
Changes in water content of vegetation canopies using green and near-infrared (NIR) light. NDWI is also commonly applied to detect surface water.
What NDWI tells farmers:
NDWI supports monitoring of vegetation water stress, helps optimize irrigation efficiency, and tracks changes in surface water availability.
How OnGeo Intelligence Supports Agricultural Monitoring
OnGeo Intelligence makes satellite-based crop monitoring accessible to everyone from smallholder farmers to large agribusinesses—without the need for specialized software or subscriptions. Key features include:
- No subscription or account needed – Reports can be ordered in just a few simple steps.
- Accessible data – High-resolution imagery and NDVI analysis are delivered in a readable .pdf format, ready for interpretation.
- Free Sentinel-2 reports – Using the code ongeo100, users can generate a report with Sentinel-2 scenes at no cost.
- Ease of use – No specialist knowledge is required; anyone can monitor fields remotely.
- Comprehensive insights – OnGeo reports provide actionable crop health information, highlighting areas under stress, growth patterns, and potential yield concerns.
- Time efficiency – Access to satellite-based insights in hours rather than days, supporting timely interventions and improved decision-making.
Get started with OnGeo Intelligence
Generating your free satellite imagery report with key farm indices takes just minutes:
- Visit the OnGeo Intelligence platform.
- Go to the order form and easily select your field(s) using the interactive map.
- Specify the time period you want to analyze.
- Apply code ongeo100 during checkout to unlock your free report.
- Receive your comprehensive report (including index graphs) via email, often within minutes!
Case Study Examples (Conceptual)
The following scenarios illustrate how satellite imagery is commonly applied in agricultural monitoring. While conceptual, they reflect real-world workflows used by farmers, agronomists, and agricultural planners around the world.
Case Study 1: Early Detection of Drought Stress in Cereal Crops
In a large cereal-growing region, satellite NDVI analysis shows a gradual but consistent decline in vegetation health compared to historical averages for the same period. Ground conditions still appear normal, and no visible wilting is present.
- Satellite insight:
NDVI time-series data reveals reduced photosynthetic activity, indicating early water stress. - Action taken:
Farmers adjust irrigation schedules and prioritize affected fields. - Result:
Crop stress is mitigated early, preventing yield loss and reducing long-term water use.
Case Study 2: Identifying Uneven Crop Development Within a Single Field
Multispectral satellite imagery of a commercial farm reveals strong variability in vegetation vigor across the same field. Some zones show consistently lower NDVI values over multiple satellite passes.
- Satellite insight:
Persistent low NDVI areas suggest nutrient deficiencies or poor soil conditions. - Action taken:
Targeted soil testing and variable-rate fertilizer application are applied only where needed. - Result:
Crop uniformity improves while fertilizer costs and environmental impact are reduced.
Case Study 3: Monitoring Crop Recovery After Flooding or Heavy Rainfall
Following a period of intense rainfall, satellite imagery is used to assess crop conditions across flooded agricultural land. Initial imagery shows widespread vegetation stress, followed by gradual recovery in some areas.
- Satellite insight:
Time-series analysis distinguishes between fields recovering naturally and those showing long-term damage. - Action taken:
Farmers focus replanting efforts on severely affected fields and avoid unnecessary intervention in recovering areas. - Result:
Resources are allocated efficiently, supporting faster recovery and reduced losses.
Case Study 4: Detecting Pest or Disease Outbreaks at an Early Stage
Satellite imagery identifies irregular patterns of declining vegetation health spreading across adjacent fields over time.
- Satellite insight:
Spatial and temporal patterns suggest a potential pest or disease outbreak rather than uniform environmental stress. - Action taken:
Field inspections confirm the issue, and targeted pest control measures are applied. - Result:
The outbreak is contained early, limiting crop damage and reducing pesticide usage.
Case Study 5: Regional Crop Performance and Yield Estimation
Agricultural analysts monitor satellite imagery across an entire growing season for a major crop-producing region. Vegetation indices are compared with historical data from previous years.
- Satellite insight:
Overall crop development appears slightly below average due to delayed planting and reduced rainfall. - Action taken:
Regional planners adjust yield forecasts and prepare for potential supply impacts. - Result:
Improved planning for storage, transport, and market expectations.
These case studies demonstrate how satellite imagery transforms agriculture from reactive field inspections to proactive, data-driven management—helping improve productivity, sustainability, and resilience at both farm and regional scales.
Why This Matters
Agriculture is increasingly data-driven, and timely insights can make the difference between a successful harvest and crop loss. Satellite imagery allows farmers and agronomists to:
- Detect problems early: Identify drought stress, nutrient deficiencies, pest infestations, or disease outbreaks before they are visible on the ground.
- Optimize resources: Apply water, fertilizers, and pesticides only where needed, reducing costs and environmental impact.
- Plan better: Track crop growth over time, compare with historical data, and forecast yields for improved logistics and market decisions.
- Monitor at scale: Cover large or remote fields that are difficult to inspect in person, ensuring no area is overlooked.
By turning raw satellite data into actionable insights, agricultural stakeholders can make proactive decisions, improve productivity, and reduce risks.
Final Thoughts Satellite Imagery for Agriculture
Satellite imagery has transformed the way we approach agriculture. From monitoring crop health and detecting early stress to optimizing resource use and forecasting yields, these insights allow farmers and agronomists to act faster and smarter.
Platforms like OnGeo make this technology accessible to everyone removing barriers such as subscription fees, specialist software, or technical expertise. By combining high-resolution imagery with practical reports, users can make informed decisions at both field and regional scales.
As we move further into 2026, integrating satellite data into everyday agricultural practices will become not just an advantage but a necessity for sustainable, efficient, and resilient farming. Whether you’re a smallholder farmer or managing large-scale agricultural operations, satellite monitoring empowers you to see the bigger picture literally from space while acting locally on the ground.
Related articles
- Spectral Bands: A Guide to Popular Index Formulas
- How Often Do satelites Take Pictures? Satellite Imagery Frequency
- Satellite Forest Monitoring from Space: Global Tree Mapping with Satellite Earth Observation
- How to Get Live Satellite Images: Real-Time Options
- What is GEOINT? The Power and Limits of Geospatial Intelligence in the Modern World