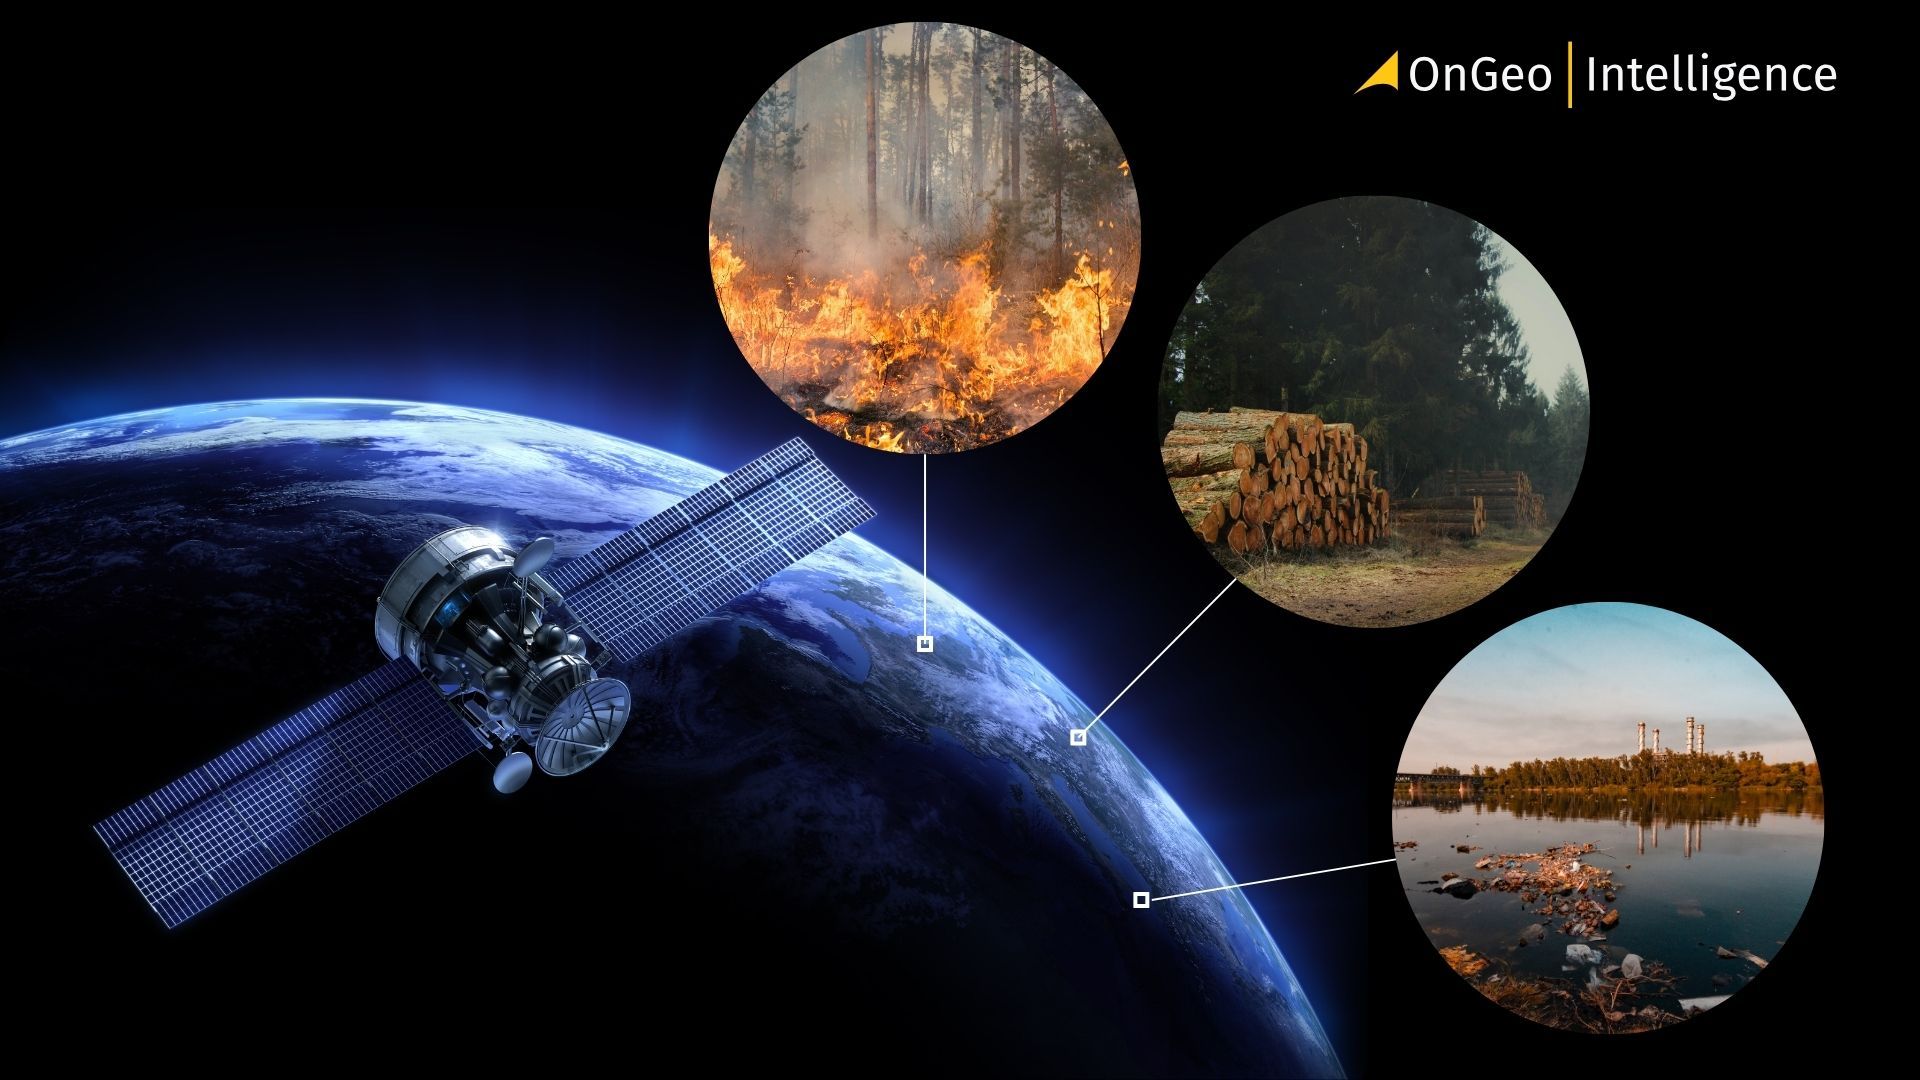
Environmental Monitoring Using Satellite Data
How can we effectively monitor environmental damage in remote areas far from cities, borders, or inspection teams? Issues like illegal deforestation, water pollution, and air quality degradation often occur beyond the reach of traditional ground-based monitoring.
Satellite data offers a powerful solution. By providing continuous, large-scale observations from space, satellites reveal environmental changes and patterns that would otherwise remain hidden.
This article explores how satellite imagery and Earth observation data are used for air and water quality tracking, deforestation detection, pollution analysis, and more informed environmental decision-making.
How Satellite Data Supports Environmental Monitoring
Satellite data enables environmental monitoring by providing consistent, large-scale, and repeatable observations of the Earth’s surface and atmosphere. Unlike ground-based sensors, satellites can monitor remote, politically sensitive, or inaccessible areas without physical presence.
At the core of this capability is remote sensing, where satellites measure reflected or emitted energy across different parts of the electromagnetic spectrum. These measurements are then translated into indicators of environmental conditions and change.
Key ways satellite data supports environmental monitoring include:
Wide-area coverage
Satellites can monitor entire regions, countries, or continents in a single pass. This makes them ideal for tracking large-scale environmental issues such as deforestation, desertification, and marine pollution.
Time-series monitoring
By capturing images of the same location at regular intervals, satellite data allows analysts to detect trends and sudden changes such as forest loss, drought development, or pollution events over time.
Objective and verifiable data
Satellite imagery provides independent, timestamped evidence that can support environmental reporting, regulatory enforcement, and scientific research.
Integration with other data sources
Satellite-derived insights are often combined with ground measurements, climate models, and geographic information systems (GIS) to create a more complete understanding of environmental processes.
Together, these capabilities make satellite data a critical tool for monitoring environmental health, identifying emerging risks, and supporting timely intervention.
Monitoring Air Quality from Space
Air pollution is one of the most difficult environmental problems to monitor using ground-based sensors alone. Monitoring stations are expensive to install and maintain, and in many regions they are sparse or completely absent. Satellite data helps bridge this gap by providing broad, consistent observations of atmospheric conditions.
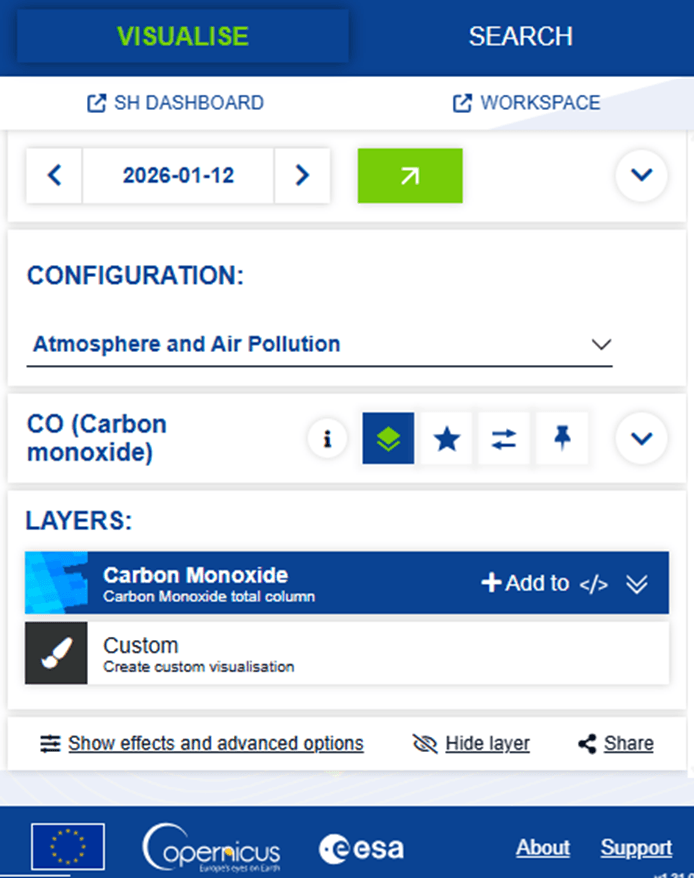
Satellites equipped with atmospheric sensors measure gases and particles by detecting how they absorb or scatter sunlight and thermal radiation. From these measurements, scientists can estimate concentrations of key air pollutants, including nitrogen dioxide (NO₂), sulfur dioxide (SO₂), ozone (O₃), and particulate matter.
One of the most widely used satellites for air quality monitoring is Sentinel-5P, which carries the TROPOMI instrument. It provides near-daily global coverage and is commonly used to track:
- Urban and industrial air pollution
- Emissions from power plants and refineries
- Pollution transport across regions and borders
- Changes in air quality during major events, such as wildfires or lockdowns
Satellite-based air quality data is particularly valuable for:
- Identifying pollution hotspots
- Monitoring long-term trends
- Supporting environmental policy and compliance
- Complementing ground sensor networks
While satellite data does not replace on-the-ground air quality measurements, it provides an essential regional and global context allowing authorities and researchers to see where pollution originates, how it spreads, and how it changes over time.
Deforestation and Land Degradation Tracking
Deforestation and land degradation often happen gradually, making them hard to detect with ground inspections alone. Satellite imagery offers a consistent, objective way to monitor land cover changes over time, even in remote or protected areas.
Optical satellites like Landsat and Sentinel-2 are widely used to track forest cover and vegetation health. By comparing images taken at different times, analysts can detect:
- Forest clearing and illegal logging
- Agricultural or mining expansion
- Wildfire damage and recovery
- Soil exposure and land degradation
Vegetation indices such as NDVI help highlight changes in plant health and density. In cloudy tropical regions, radar satellites like Sentinel-1 provide reliable monitoring as they can penetrate clouds and operate day and night.
Satellite-based monitoring enables early warning systems, enforcement of environmental laws, carbon accounting, and better conservation planning. It transforms deforestation from an invisible process into measurable, actionable data.
Combining Satellite Data with Time-Series Analysis
While single images provide useful snapshots, time-series analysis unlocks the full potential of satellite data. By stacking multiple images of the same area over days, months, or years, analysts can track trends, patterns, and cause-and-effect relationships.
This approach is particularly effective for monitoring:
- Progressive deforestation and land degradation
- Seasonal vegetation cycles and long-term ecosystem shifts
- Pollution source expansion
- Recovery after disasters like floods or wildfires
Satellite indices (NDVI, EVI, surface reflectance) plotted over time reveal sudden drops (e.g., illegal logging or fires) or gradual declines (e.g., drought or soil degradation).
Modern cloud platforms and automated tools now allow fast, large-scale analysis, enabling near real-time monitoring and shifting environmental management from reactive to proactive.
Water Quality and Aquatic Monitoring
Monitoring water quality in rivers, lakes, coastal zones, and reservoirs is difficult using only ground-based methods, especially for large, remote, or transboundary water bodies. Satellites provide frequent, wide-area coverage of aquatic environments.
Optical satellites such as Sentinel-2 and Landsat analyze light reflected from water surfaces to detect key indicators, including:
- Algal blooms and eutrophication
- Sediment load and turbidity
- Changes in water extent and seasonal drying
- Pollution events from nearby industrial or urban areas
One widely used metric is turbidity, which reflects how cloudy or sediment-laden water is. Sudden increases in turbidity can signal upstream deforestation, construction activity, or flood-related runoff. Similarly, changes in water color can indicate algal blooms, which may threaten drinking water supplies and aquatic life.
A Step-by-Step Environmental Monitoring Workflow Using Copernicus Data Space
1. Define the Monitoring Goal
Identify what you want to track air quality, deforestation, water pollution, or land degradation. This determines the satellite data and analysis approach.
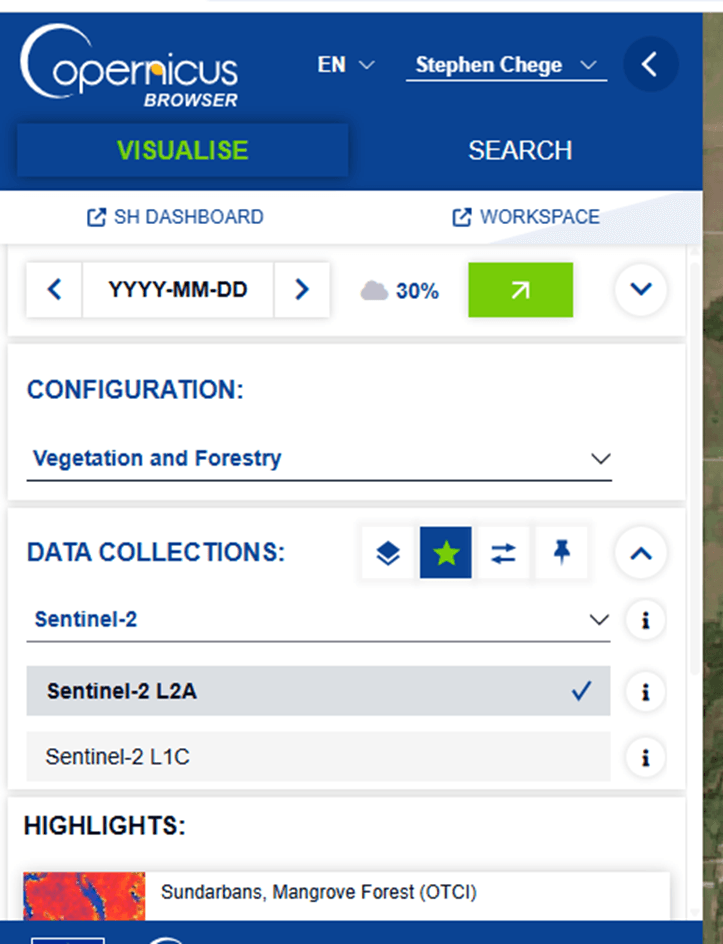
2. Choose the Right Copernicus Satellite
Select the appropriate Sentinel mission:
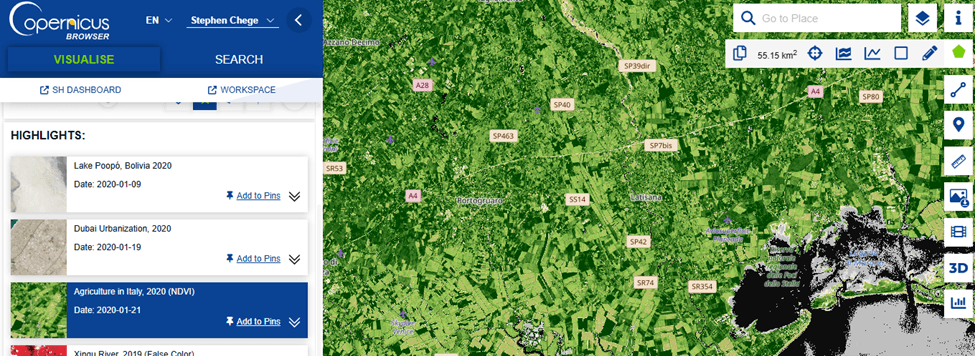
- Sentinel-2 for land cover, vegetation, and water
- Sentinel-5P for atmospheric pollutants
- Sentinel-1 for radar-based monitoring in all weather conditions
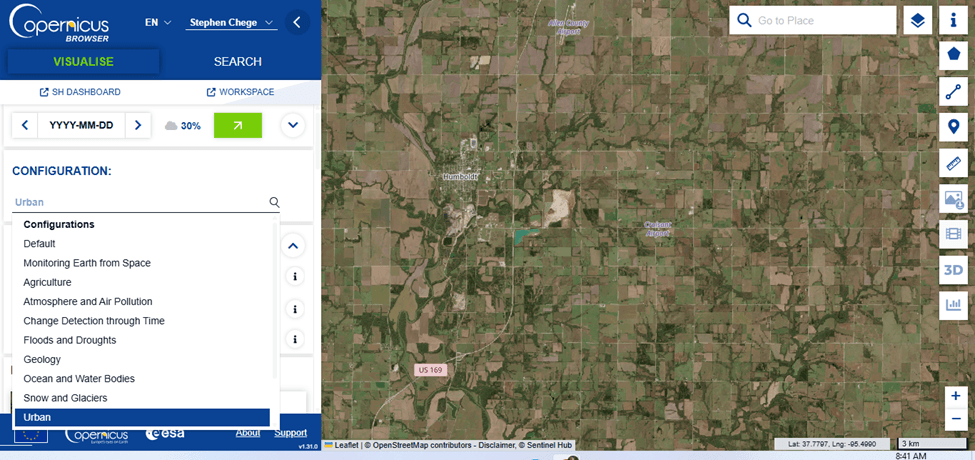
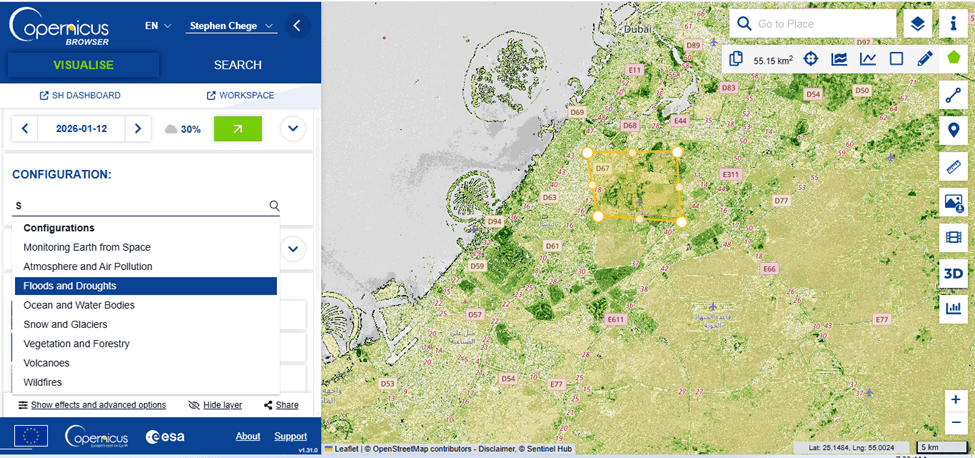
3. Access Data via Copernicus Data Space
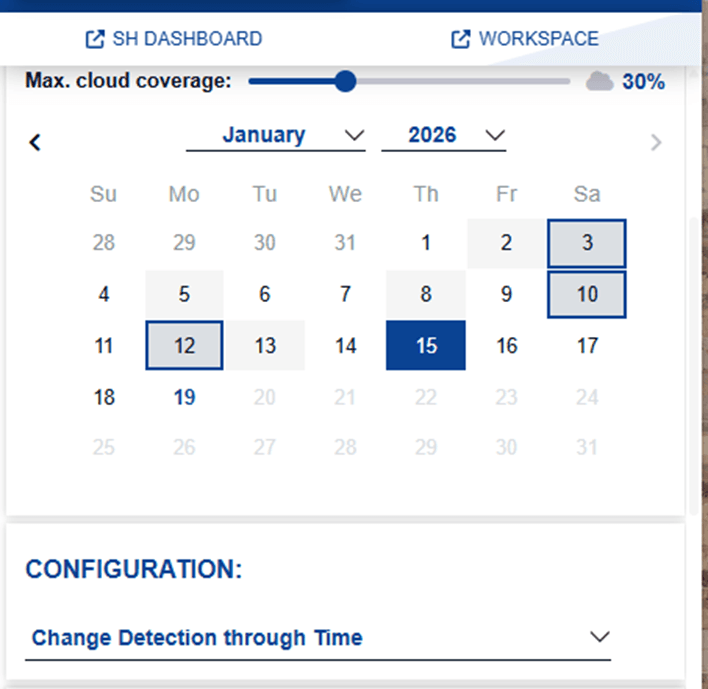
Use the Copernicus Data Space Ecosystem to define your area of interest, time range, and data filters such as cloud coverage.
4. Analyze Changes Over Time
Apply time-series analysis to detect trends, seasonal patterns, or sudden environmental changes like deforestation or pollution events.
5. Visualize and Validate Results
Create maps and charts to interpret results and, where possible, validate findings using ground data or external reports.
How OnGeo Supports Environmental Monitoring
Accessing and interpreting satellite data can be complex, especially for users without specialized remote sensing expertise. OnGeo Intelligence simplifies this process by making satellite-based environmental insights more accessible and easier to use.
Through OnGeo Intelligence, users can generate location-based satellite reports that support environmental monitoring tasks such as land-use change analysis, vegetation assessment, and surface condition review. Instead of working directly with raw satellite datasets, users receive structured outputs that are easier to interpret and share.
OnGeo Intelligence helps turn Earth observation into a practical tool for monitoring environmental change and supporting more informed environmental decisions.
Satellite Imagery Report for free! Code: ongeo100
Use the code ongeo100 to download a free OnGeo Intelligence Satellite Imagery Report with low-resolution images 10m, perfect for analyzing large areas this is your chance for free access to satellite data.
Why This Matters and How to Get Started
Environmental issues like pollution, deforestation, and water degradation are often hard to detect early, yet delayed action can lead to irreversible damage. Satellite data helps close this gap by delivering objective, large-scale, and repeatable insights.
By making environmental change visible, satellite imagery enables better decision-making for protection, policy enforcement, research, and public awareness. It shifts environmental management from reactive to proactive, allowing risks to be identified before they become crises.
Getting started no longer requires advanced expertise. Many satellite datasets are freely available, and user-friendly platforms like OnGeo Intelligence turn raw imagery into clear, actionable, location-based reports.
Final Thoughts Environmental Monitoring
Satellite data has become an essential tool for monitoring environmental change at scale. From air pollution and deforestation to water quality and land degradation, Earth observation provides insights that are often impossible to achieve through ground methods alone.
When combined with time-series analysis and modern platforms, satellite imagery transforms environmental monitoring into a continuous, evidence-based process critical in today’s rapidly changing world.
As access improves, tools like OnGeo Intelligence are making satellite data easier to understand and use, helping more people turn Earth observation into practical, actionable environmental insight.
Related articles
- Satellite Forest Monitoring from Space: Global Tree Mapping with Satellite Earth Observation
- Where to Find Satellite Imagery from a Specific Period? Explore OnGeo Intelligence Archives!
- Satellites vs. Deforestation: Monitoring Earth's Forests
- How to Master Satellite Image Analysis: A Beginner's Step-by-Step Guide
- Amazon Deforestation: What Satellite Reports Reveal
- How Satellite Imagery Improves Crisis Management and Disaster Response
- How SWIR Satellite Imagery Detects Wildfires Through Smoke