How Satellites Monitor Climate Change
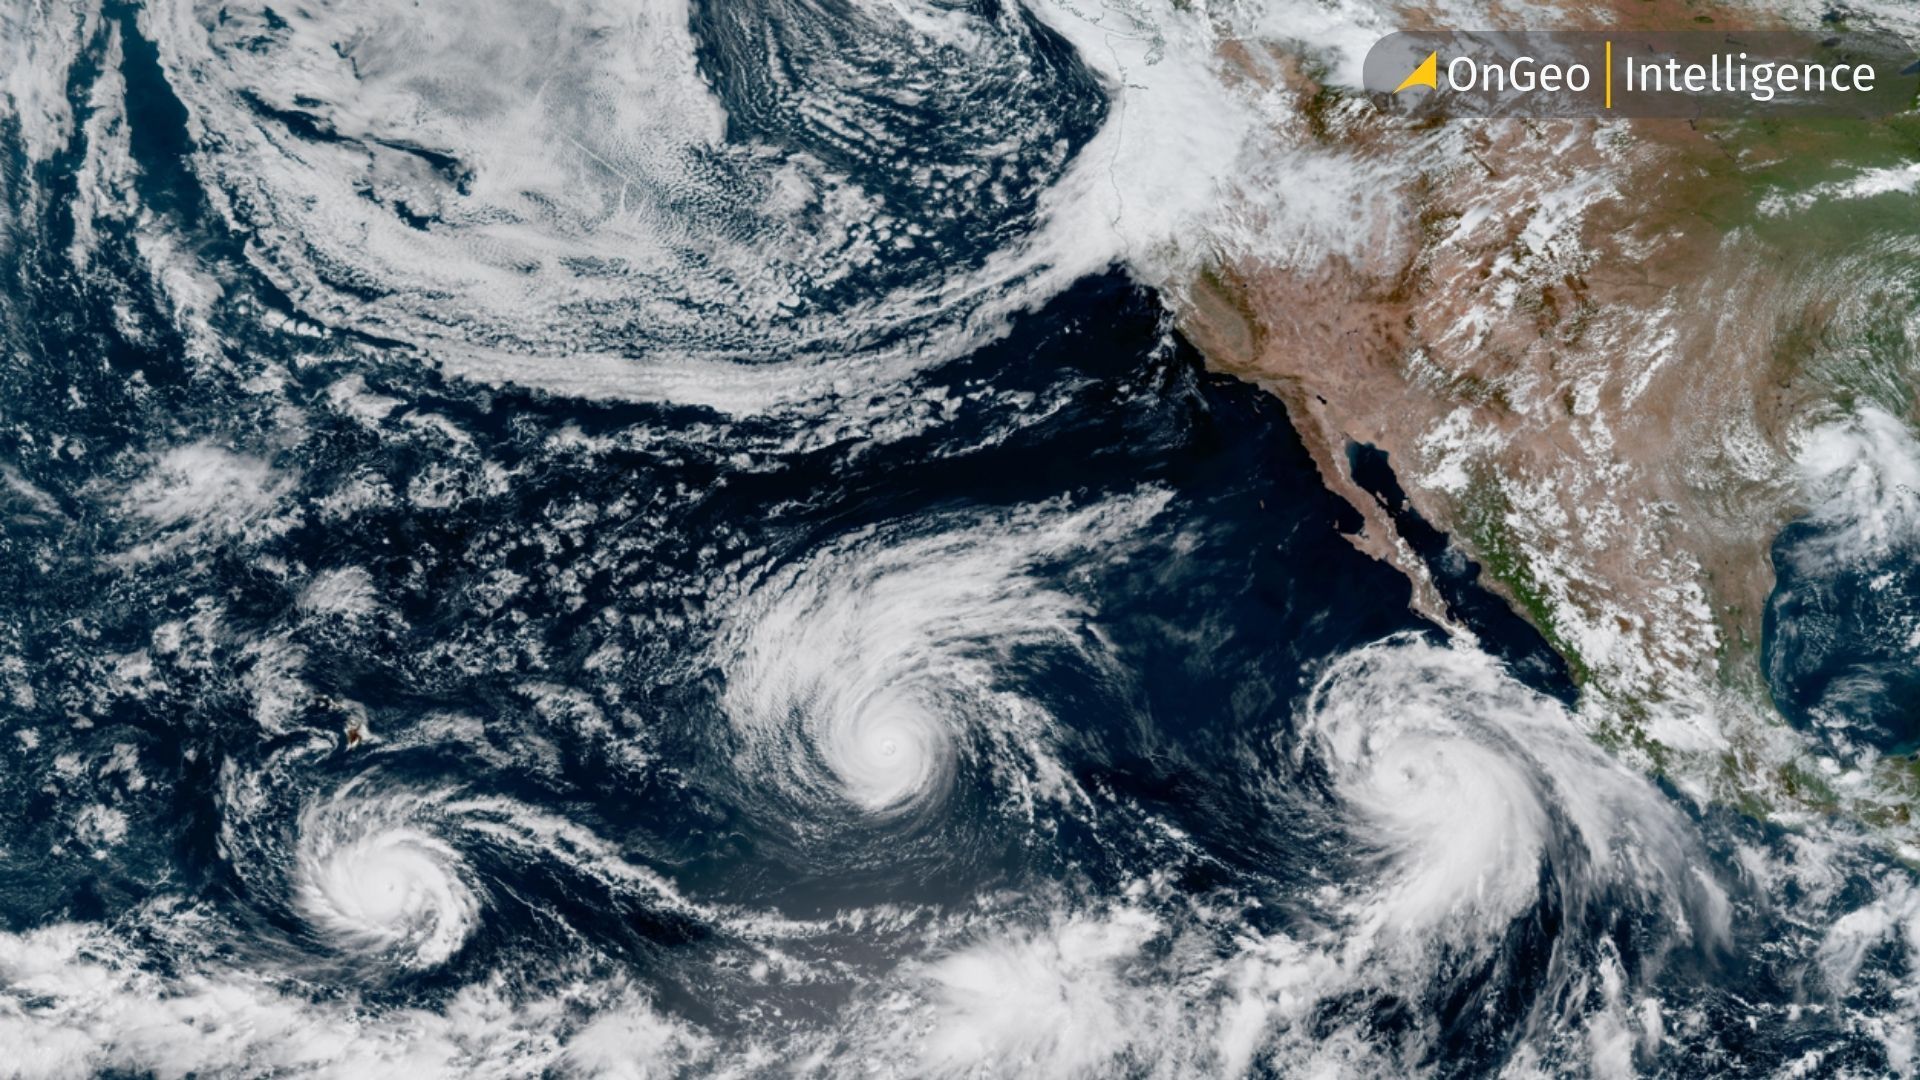
Local weather stations record temperature at a single point. Ice cores reveal atmospheric conditions from thousands of years ago at one site. Neither approach alone can show what is happening across the entire planet at the same time, in a consistent way, year after year. Satellites fill that gap. They observe Earth as one connected system, using the same methods repeatedly over decades.
NASA currently runs more than twenty dedicated Earth science satellites. Many of the most important climate datasets now cover thirty years or longer. That length of record makes it possible to distinguish real trends from ordinary short-term variation. European programs such as Copernicus, with its Sentinel fleet, add further global coverage and continuity.

Sea Level: A Reliable Long-Term Indicator
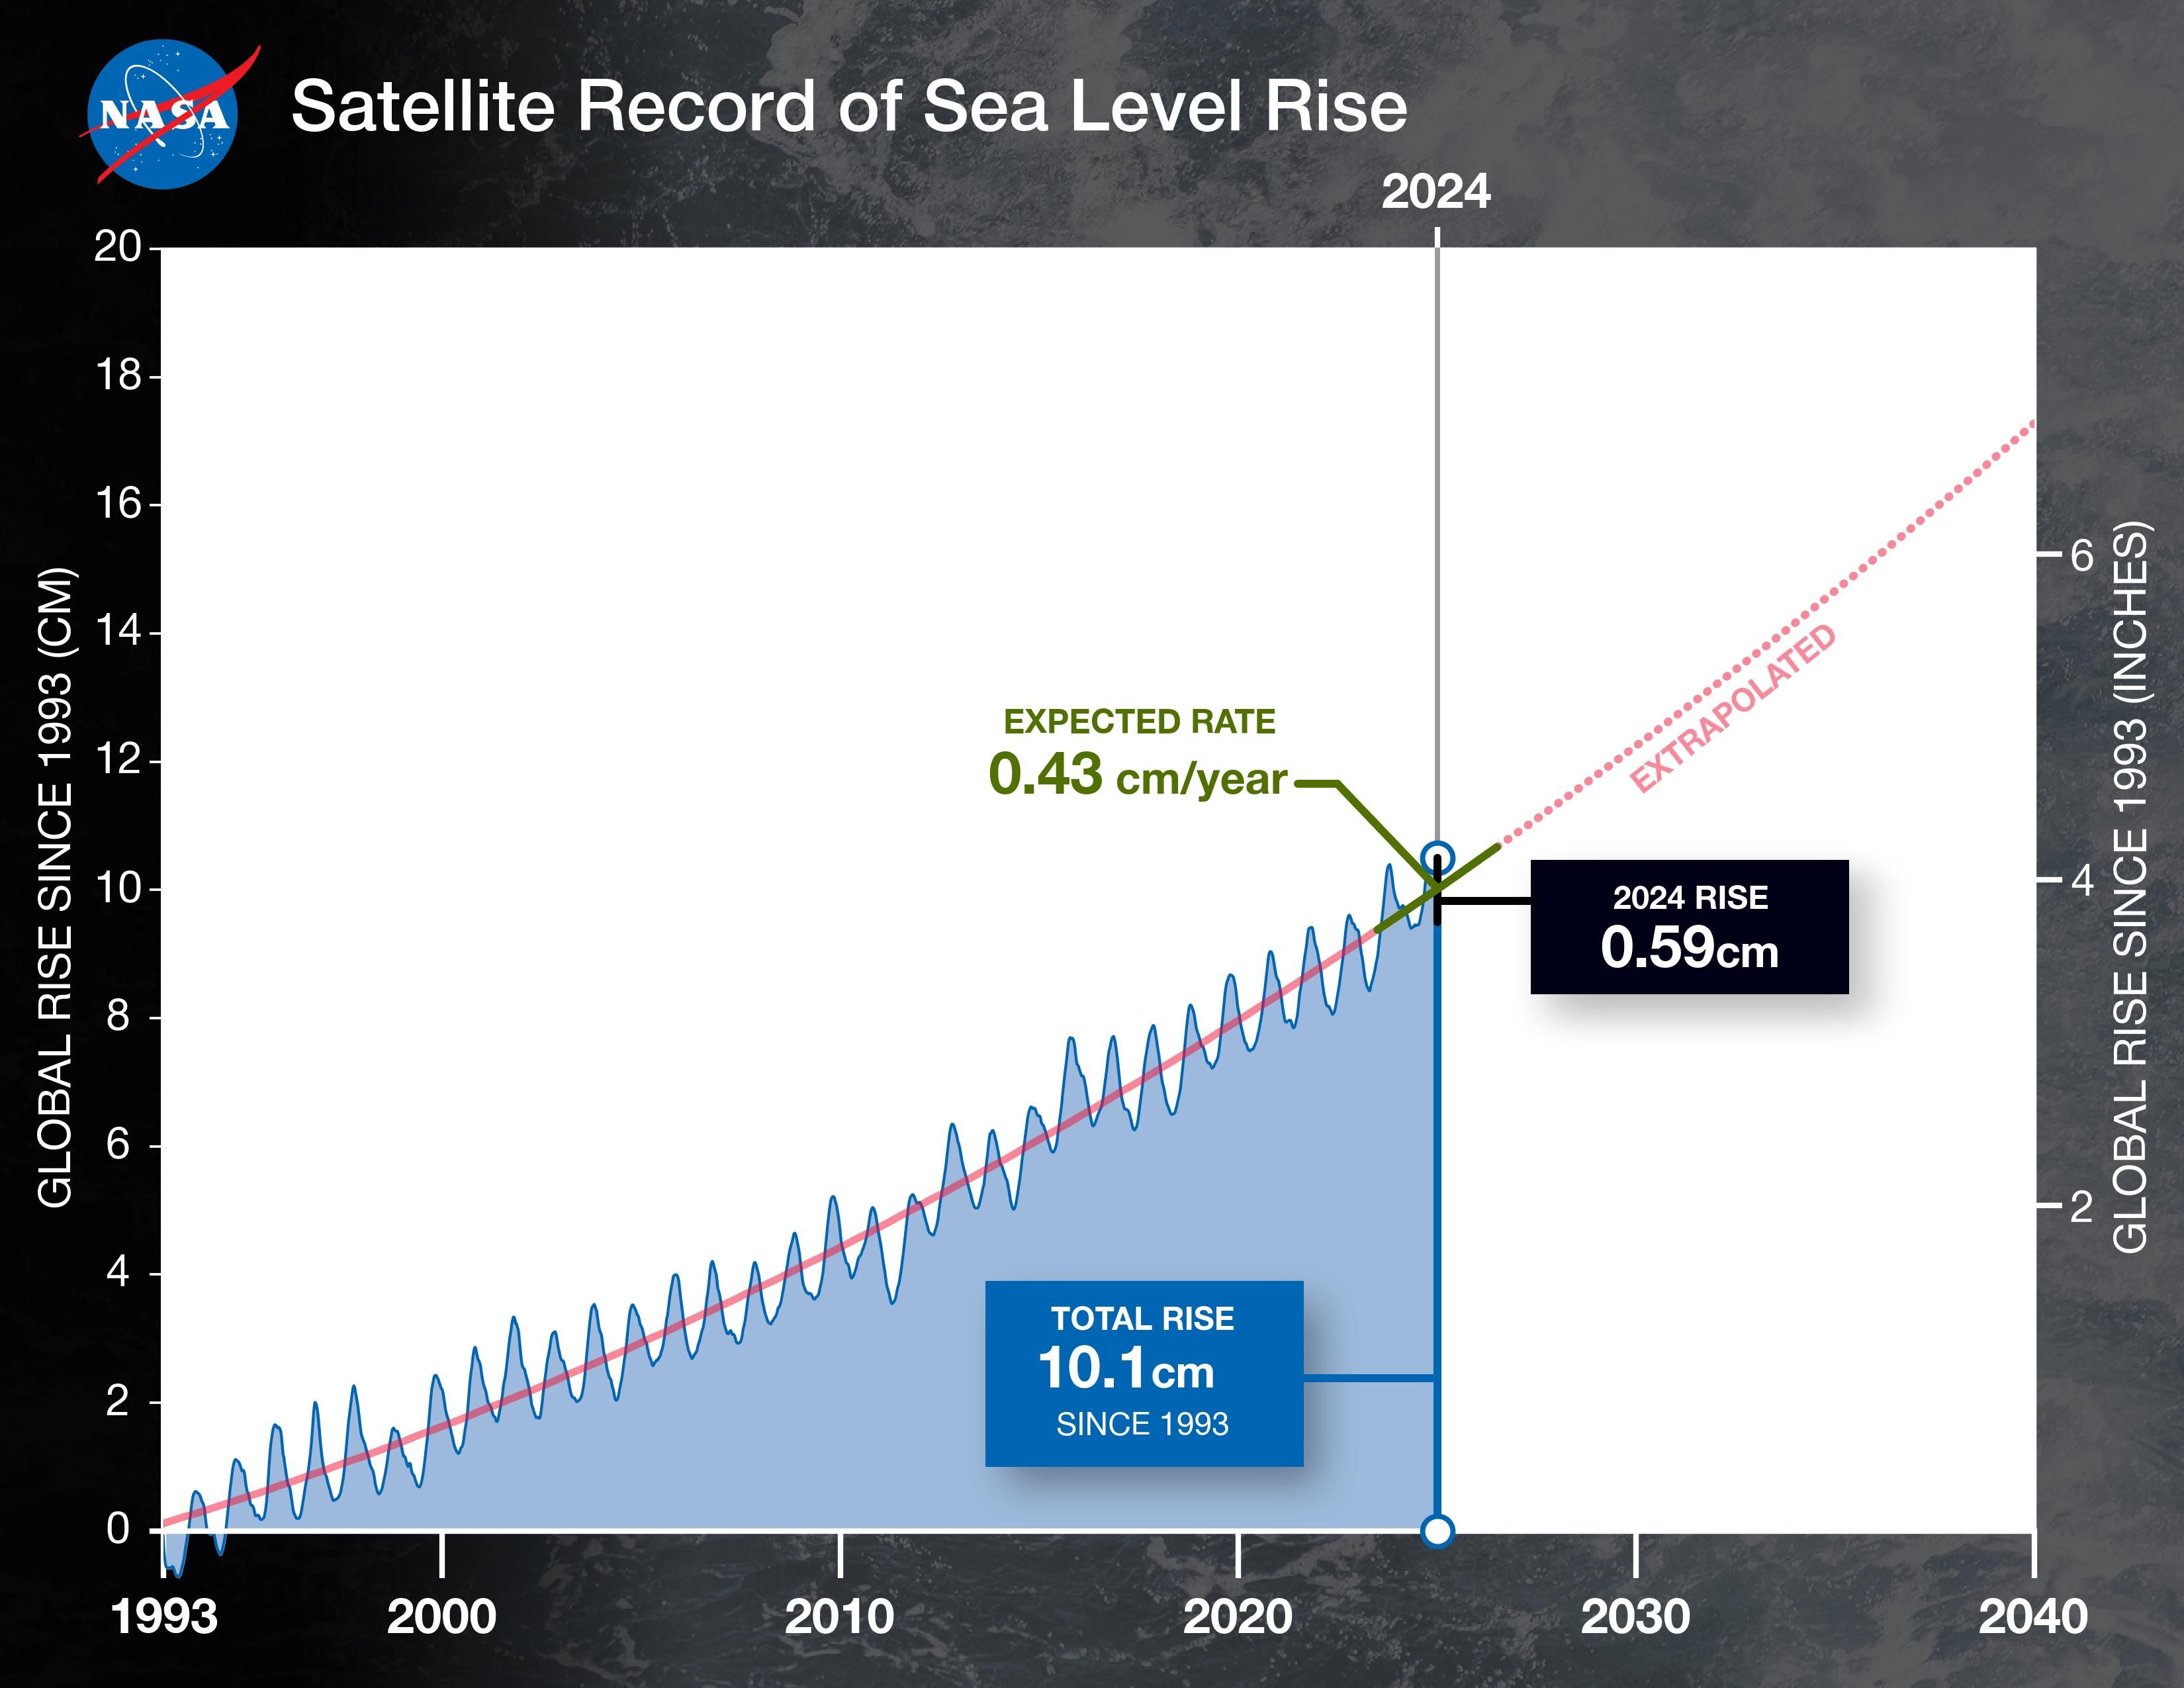
Sea level offers one of the clearest climate signals because a continuous satellite record has existed since 1993. The sequence began with TOPEX/Poseidon, continued through the Jason series, and now includes the Sentinel-6 missions. Each new satellite overlaps with its predecessor so the measurements stay calibrated and unbroken.
According to NASA’s satellite altimetry data, global sea level has risen about 3.6 inches (91 millimeters) since 1993. Roughly two-thirds of that rise comes from melting glaciers and ice sheets. The rest results from thermal expansion as ocean water warms and expands. Sentinel-6B, launched in late 2025, extends this record with higher precision through ongoing cooperation between NASA and European space agencies.
Radar altimeters on these satellites bounce signals off the ocean surface and time the return with millimeter-level accuracy. Millions of measurements are combined to produce the global trend.
Ice Sheets: Tracking Change in Remote Places
Antarctica and Greenland contain most of Earth’s freshwater ice. Measuring mass loss on the ground at the required scale is nearly impossible because of the extreme conditions and vast distances. Satellites solve the problem with laser and radar altimetry. They measure the height of the ice surface from orbit and detect thinning over time.
NASA’s ICESat-2 uses a precise laser altimeter that can register small elevation changes across ice sheets and even estimate snow depth. Other missions, including ESA’s CryoSat and the GRACE gravity satellites, measure mass loss by detecting shifts in Earth’s gravitational field. These observations feed directly into sea-level calculations, since land-ice melt is the largest single contributor. Sequential images also show accelerating glaciers, calving events, and surface melt features that ground teams can sample only in limited areas.
Carbon Dioxide: Observing the Greenhouse Effect Globally
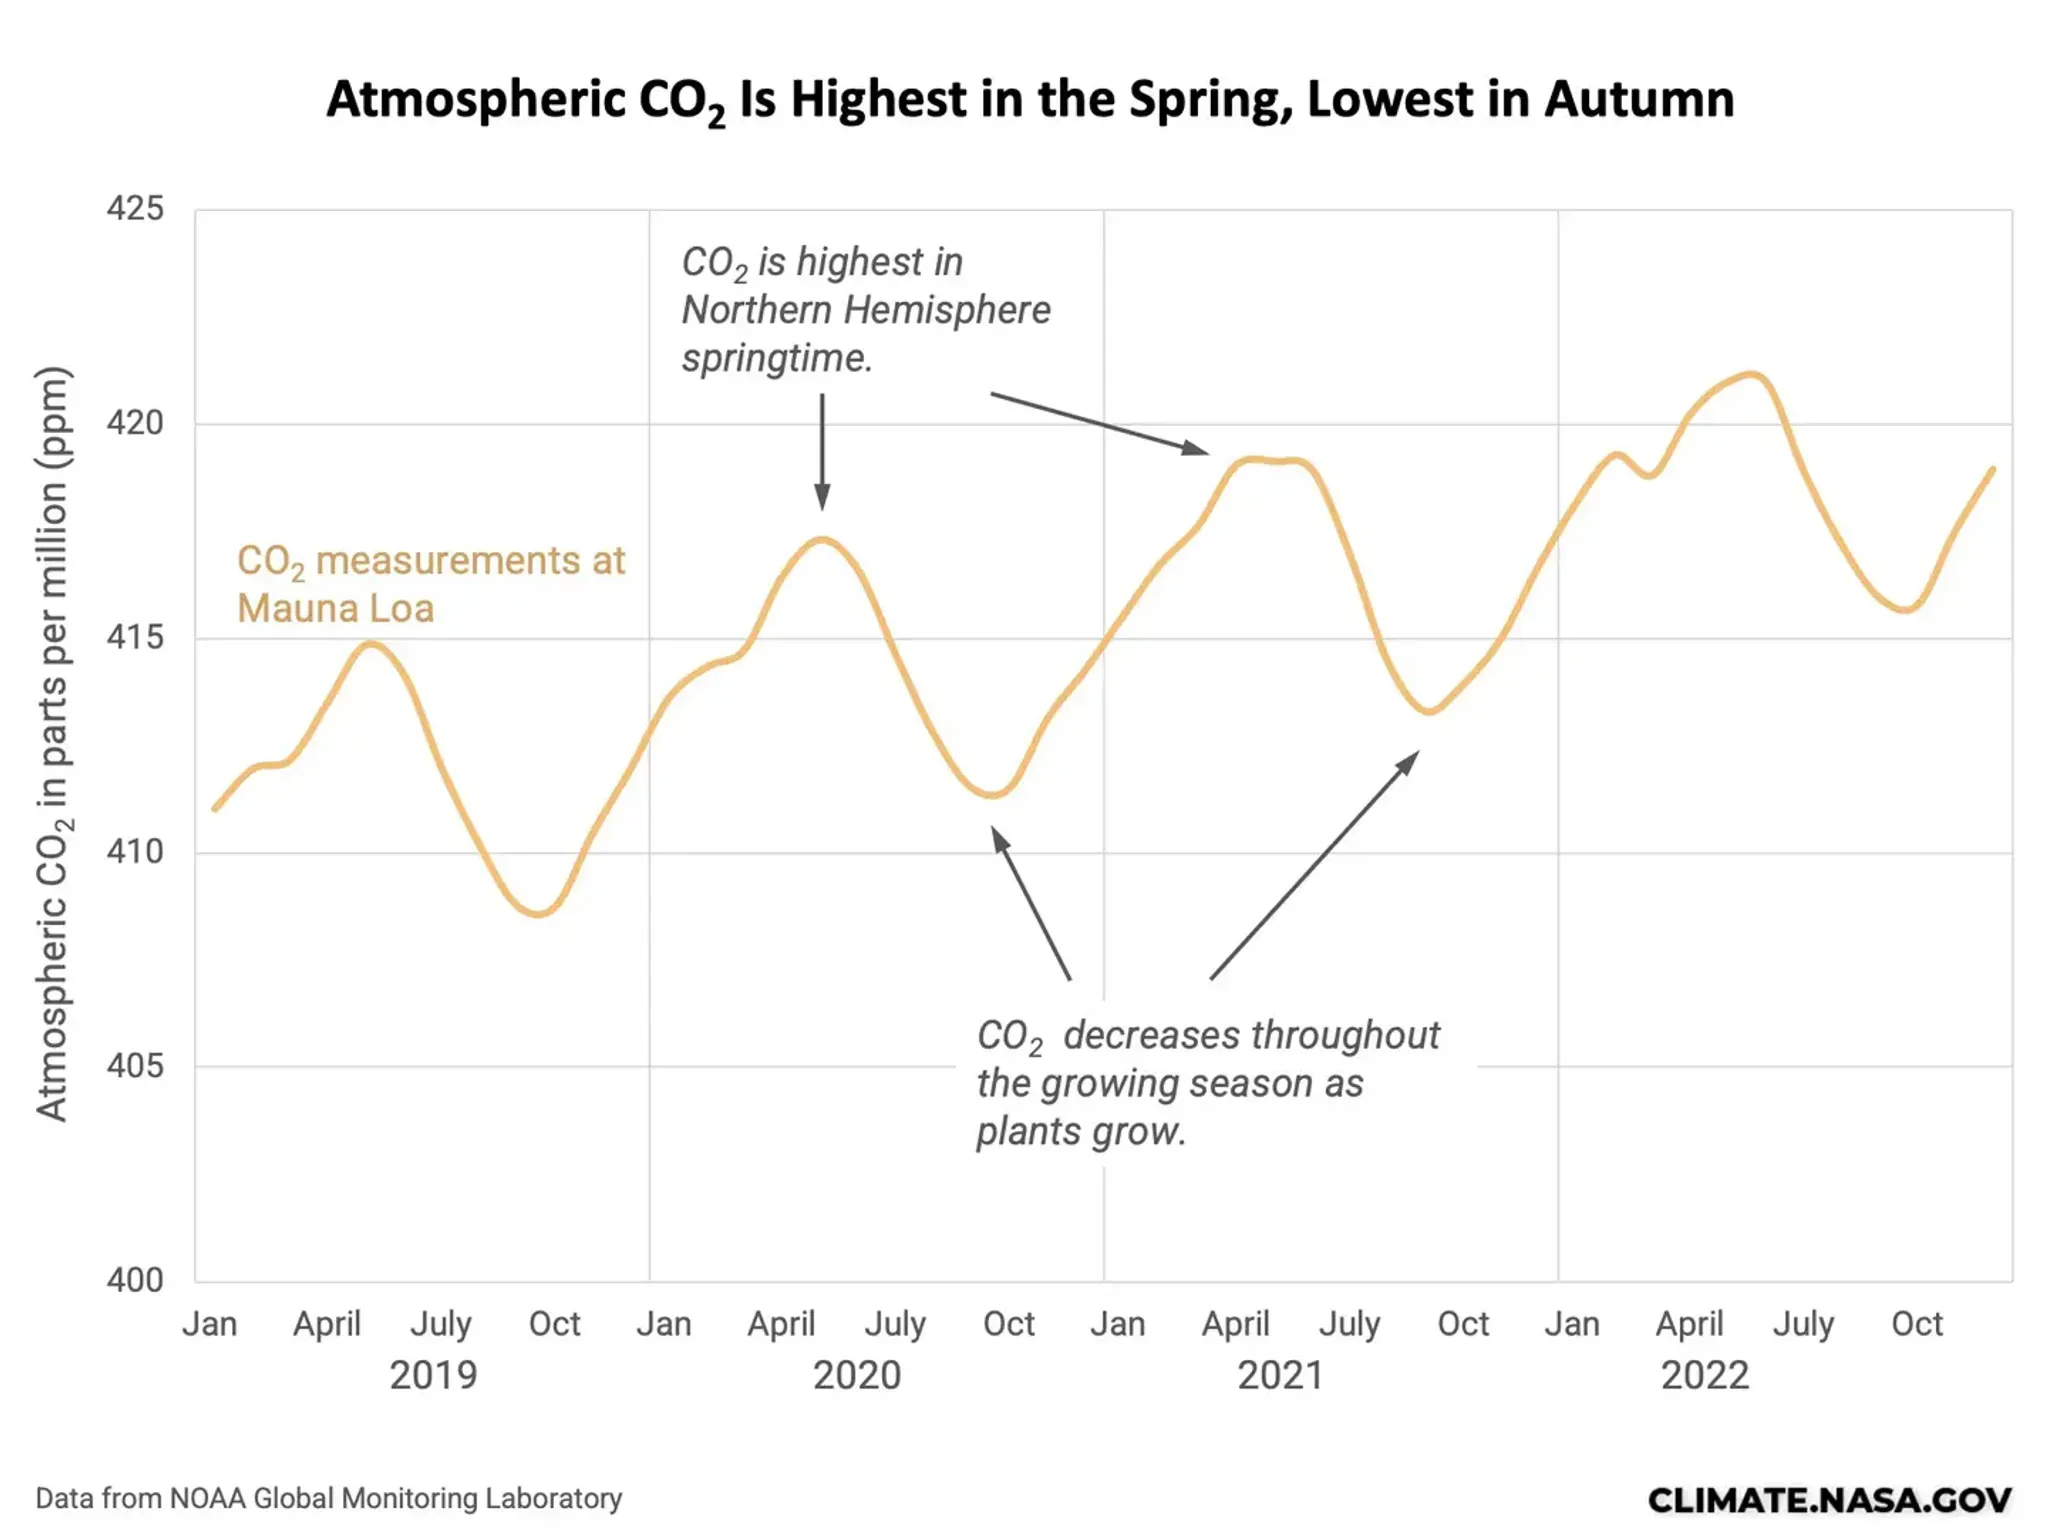
The most direct connection between satellite observations and the cause of climate change is the monitoring of atmospheric carbon dioxide. The long-term record from Mauna Loa in Hawaii, started in 1958, established the rising trend from a single location. Satellites now expand that view to the whole planet.
Instruments on missions such as NASA’s OCO-2 and OCO-3, Japan’s GOSAT series, and several European platforms map CO₂ concentrations across the globe. Both ground and space measurements show that atmospheric CO₂ has risen by more than 50 percent since the industrial era began. The increase is attributed mainly to fossil fuel use. Because carbon dioxide traps outgoing heat, this rise is the physical driver of the warming trend, a mechanism first demonstrated in laboratory experiments in the nineteenth century.
Satellites also detect methane and other greenhouse gases, identifying emission sources from wetlands, agriculture, and energy infrastructure that remain hard to quantify from the surface alone.
Additional Climate Variables Tracked from Space
Sea level, ice, and carbon dioxide attract the most attention, yet the satellite record covers many more indicators.
Ocean surface currents influence heat transport, regional weather, and marine ecosystems. Ecosystem carbon exchange data show how much carbon forests and other landscapes absorb or release, revealing shifts in health that would take far longer to document through ground surveys alone.
Permafrost monitoring captures a potential feedback: thawing ground can release stored carbon and intensify the warming that caused the thaw.
Multispectral sensors produce vegetation and water indices such as NDVI, NDWI, and NDMI. These reveal drought stress, deforestation, wildfire scars, and recovery. Satellites also track major climate cycles. In 2026, altimetry data showed early patterns consistent with a developing El Niño, detecting warmer water moving eastward across the Pacific months before surface observations made the event obvious.
Other measurements include Arctic sea-ice extent and thickness, cloud cover, radiation balance, aerosol distribution, and rapid detection of extreme events such as large wildfires or coastal flooding.
The Value of an Unbroken Record
The strength of the satellite climate record does not rest on any single mission or annual data point. It rests on continuous, calibrated measurements spanning decades. A short spike or dip in sea level or carbon dioxide carries little meaning by itself. A consistent trend across thirty years of overlapping satellite observations is far harder to attribute to instrument error or temporary natural variability. Programs such as Sentinel-6 are deliberately designed to continue existing records rather than start new, disconnected series. The aim is a multi-decade chain of comparable measurements.
Practical Access to Satellite Insights: OnGeo Intelligence
High-resolution optical and multispectral imagery, together with derived indices, supports monitoring of drought impacts on vegetation, changes in water bodies, forest condition, land-use shifts, and recovery after extreme events.
OnGeo Intelligence makes this practical layer available through its Satellite Imagery Report service. Users can request cloud-free, time-ordered high-resolution scenes for nearly any location on Earth. Each report arrives as a clear PDF that includes:
- Natural-color imagery arranged chronologically over the chosen period
- Standard remote-sensing indices (NDVI for vegetation health, NDWI for water content, NDMI for soil moisture) with graphs of change
- Georeferenced data packages Sentinel-2 bands, ready for further work in GIS software
No account or subscription is required. Lower-resolution views are typically ready within minutes; higher-resolution data usually arrives within 48 hours. This approach turns the same satellite technologies that support global climate monitoring into tools for examining local conditions, whether assessing drought on farmland, documenting coastal change, tracking forest cover, or gathering visual evidence for planning and reporting.
Free satellite imagery reports
Use the code ongeo100 to download a free OnGeo Intelligence Satellite Imagery Report with low-resolution images 10m.
Frequently Asked Questions
How does satellite data differ from ground-based climate measurements?
Ground stations and instruments such as tide gauges or the Mauna Loa carbon dioxide record deliver highly precise readings at fixed points over long periods. Satellites exchange some of that local precision for consistent global coverage. They measure the entire planet in the same way at the same time, which helps confirm that a trend is truly planetary rather than a local or regional effect.
Can satellites detect sea-level changes measured in millimeters?
Yes. Satellite altimeters send radar or laser signals to the ocean surface and time the return with sufficient accuracy to register millimeter-scale height differences. These readings are repeated across millions of points worldwide and averaged to produce the long-term trend.
Do satellites measure temperature directly?
Some instruments use infrared sensors to measure radiated heat. Much of the climate satellite record, however, focuses on related indicators such as sea level, ice mass, carbon dioxide concentration, and vegetation indices. These measurements are precise from orbit and together give a fuller picture than temperature alone.
Why does melting ice matter so much for sea level?
Ice sheets store large volumes of freshwater on land. When the ice melts and reaches the ocean, it adds volume directly to the sea. NASA data indicate that land-ice loss accounts for roughly two-thirds of observed sea-level rise, exceeding the contribution from thermal expansion of seawater.
How far back does reliable satellite climate data extend?
It varies by indicator. Continuous satellite sea-level measurements began in 1993. Other datasets start at different times depending on when the relevant instruments launched. Records of thirty years or more are now common for core indicators. That length is sufficient to separate genuine trends from short-term cycles such as El Niño and La Niña.
How can individuals or organizations use satellite data for climate-related monitoring without specialized skills?
Services such as OnGeo Intelligence organize historical and recent imagery into ready-to-use reports that include visual timelines and standard indices (NDVI, NDWI, NDMI). Users can track vegetation stress, water availability, land-cover change, or the local effects of extreme events without processing raw satellite archives themselves.
Related articles
- GEO vs LEO Satellite Orbits, Altitude, Latency and Applications
- Borders You Can See From Space: How Satellite Imagery Reveals the Line Between Nations
- How to get a historical satellite map of my property
- Satellite Imagery Reveals the Full Scale of Western Europe’s Most Destructive Wildfires in Decades
- Environmental Monitoring Using Satellite Data
- Satellite Imagery for Disaster Response and Recovery