
How to Add Satellite Imagery to QGIS: Step-by-Step Tutorial
Want to turn satellite imagery into actionable maps - but don’t want to pay for expensive software or struggle with complex workflows? With QGIS, you can easily load and analyze satellite data for free. Whether you're mapping changes in land cover, monitoring environmental effects, or visualizing infrastructure growth, QGIS makes it possible - even if you’re a beginner.
Satellite imagery can be used in a number of ways.
Satellite imagery has become an essential tool across industries - urban planning, environmental monitoring, agriculture, disaster response, and more. But the real power comes when you can work with these images directly inside a GIS environment. QGIS offers a flexible, beginner-friendly way to explore satellite data, apply enhancements, and extract insights without needing expensive licenses or specialized hardware. Whether you're a student, researcher, or professional, this tutorial will help you build a solid foundation for working with real-world imagery.
This guide walks you through multiple ways to add satellite imagery to QGIS: from quick online basemaps to full downloadable scenes and live map services. By the end, you’ll know how to import, visualize, and start analyzing satellite images with confidence.
Let’s dive in.
What Is QGIS?
QGIS (Quantum Geographic Information System) is a free, open-source mapping and analysis software used to work with geographic data. It allows you to view, edit, analyze, and visualize maps-including satellite imagery-without needing any paid licenses or special hardware.
Because it supports almost every geospatial data format (raster, vector, WMS, XYZ tiles, APIs, etc.), QGIS has become a popular tool for students, researchers, NGOs, governments, and private companies. Whether you’re checking land changes, mapping buildings, analyzing environmental patterns, or integrating satellite scenes for a project, QGIS gives you a complete and professional workflow at no cost.
Why Use QGIS for Satellite Imagery?
QGIS is one of the most popular open-source GIS tools, and for good reason. It allows users to visualize, analyze, and manage spatial data without any licensing fees. When it comes to satellite imagery, QGIS offers several advantages:
- Free and Open-Source: No subscription or cost is required to access powerful GIS features.
- Beginner-Friendly: The interface is intuitive, and the community provides extensive tutorials and support.
- Supports Many Formats: QGIS can handle GeoTIFF, JPEG2000, NetCDF, WMS/WMTS, and other satellite data formats.
- Flexible Analysis Tools: From simple layer visualization to complex raster calculations, QGIS allows you to process and analyze imagery efficiently.
- Extensive Plugin Ecosystem: Plugins like the Semi-Automatic Classification Plugin make working with satellite data even easier.
- Cross-Platform: Works on Windows, macOS, and Linux, so anyone can use it regardless of their system.
By using QGIS, anyone-from students and researchers to professionals-can unlock the power of satellite imagery and turn raw data into actionable insights
How to Add Satellite Imagery to QGIS: Step-by-Step Tutorial
1. Method 1: Adding Satellite Imagery via XYZ Tiles (Fastest & Easiest)
Adding satellite imagery through XYZ Tiles is the quickest way to get a basemap into QGIS. XYZ Tiles stream imagery directly from online map providers, so you don’t need to download anything beforehand.
Steps:
Open QGIS
In the Browser Panel, right-click XYZ Tiles
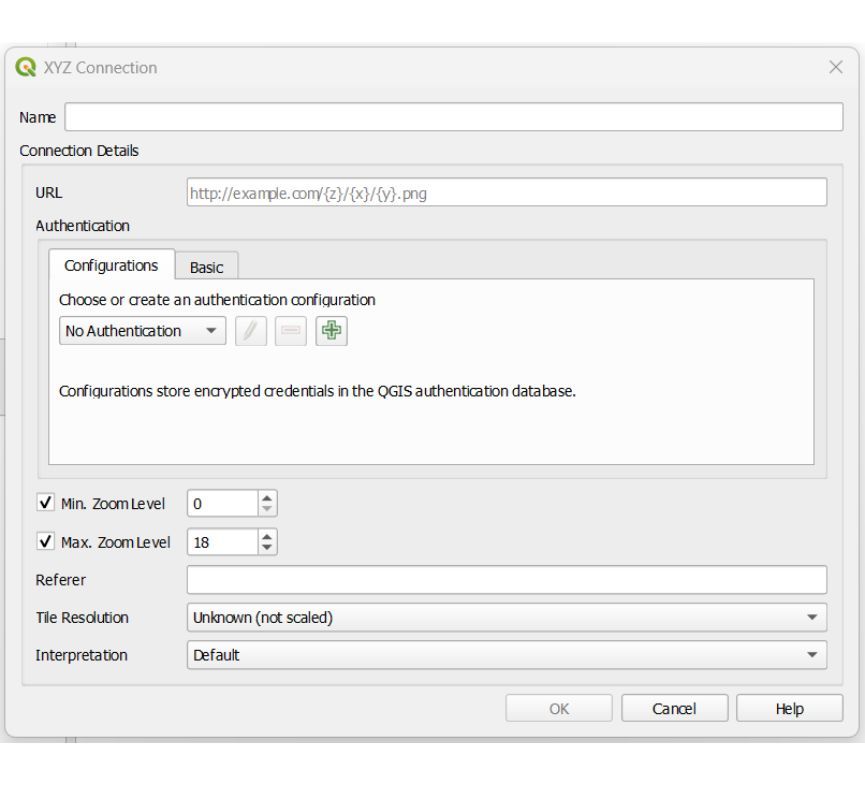
Select New Connection
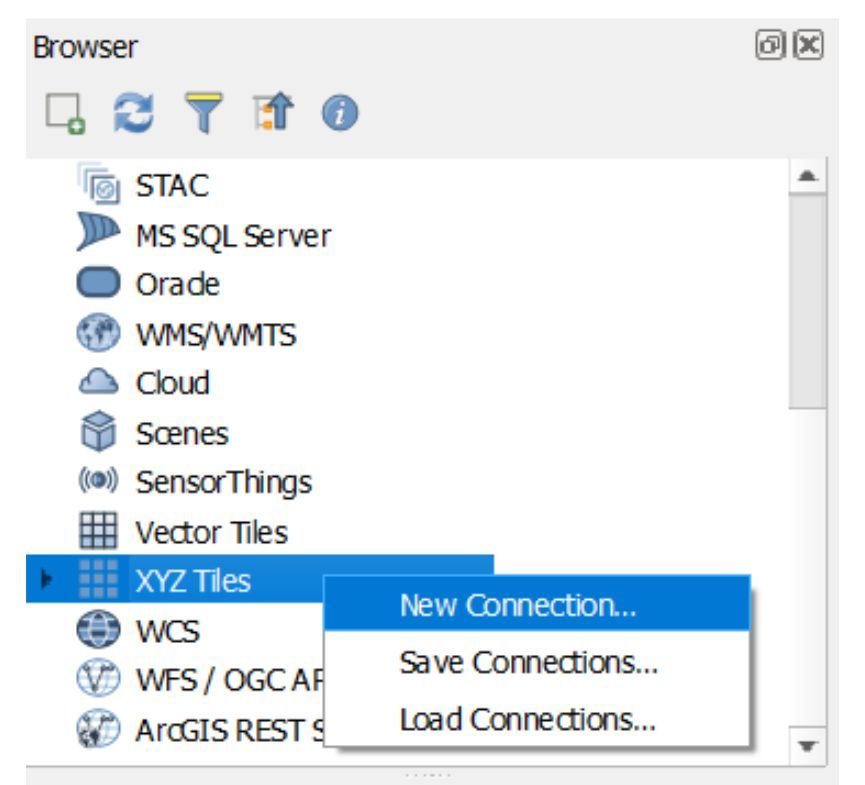
Enter a name (e.g., “Satellite – XYZ”)
Paste an XYZ link (e.g., a public satellite tile service)
Click OK, then double-click your new connection to load it into the map window
This method is ideal for quick visualization-checking areas, getting context, and referencing landscapes-without downloading full-resolution scenes. Just note: most free XYZ sources provide medium-resolution imagery and are not suitable for detailed analysis.
2. Method 2: Adding Satellite Imagery via WMS/WMTS Services (Live Map Services)
WMS (Web Map Service) and WMTS (Web Map Tile Service) allow you to stream satellite imagery directly from official providers like ESA, NASA, or national mapping agencies. These services are reliable, regularly updated, and easy to add in QGIS.
Steps:
Open QGIS
Go to Layer → Add Layer → Add WMS/WMTS Layer
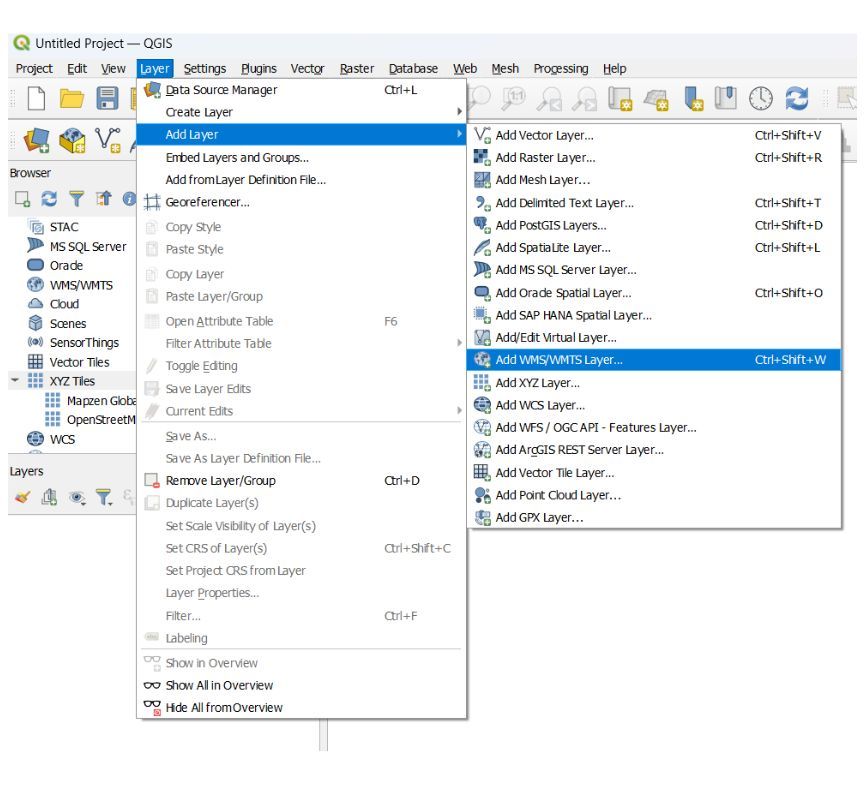
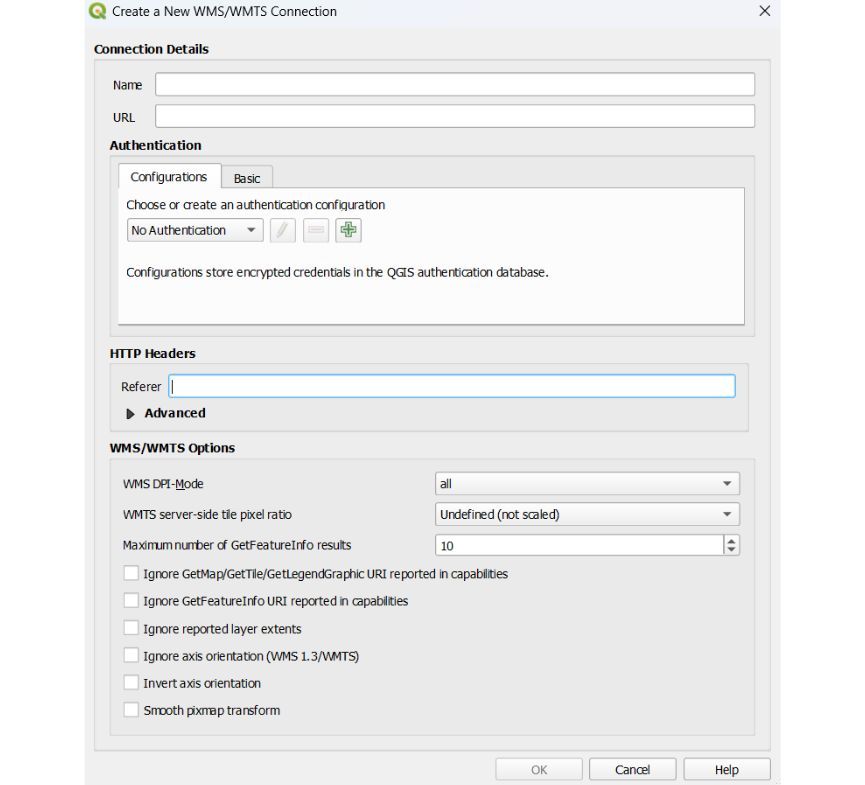
Click New to create a connection
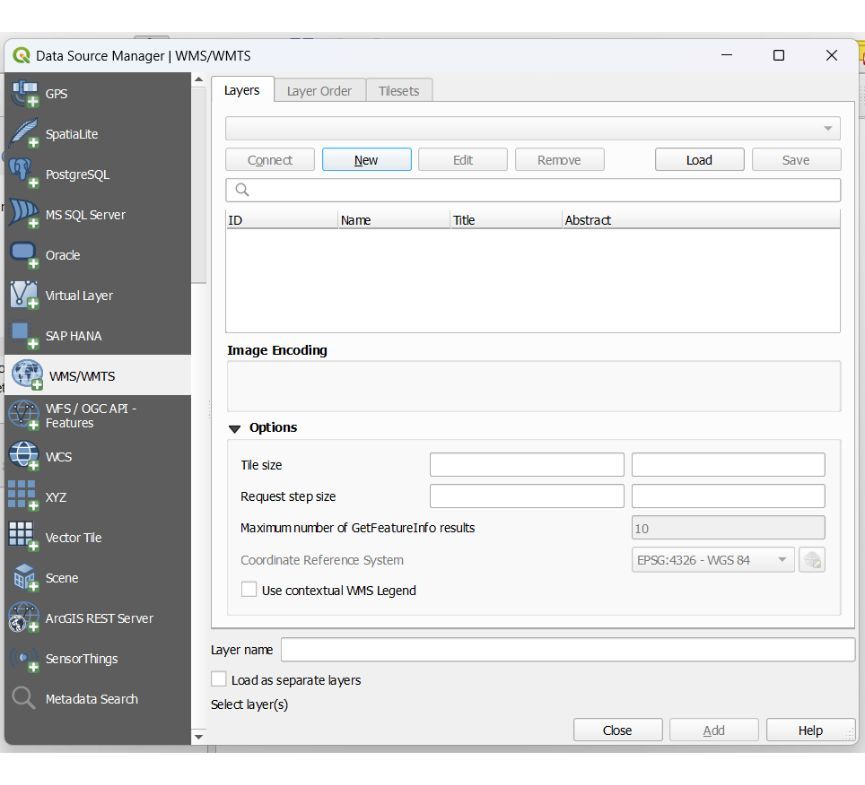
Enter a name (e.g., “Sentinel-2 WMS”)
Paste the WMS/WMTS URL provided by your data source
Click OK, then Connect
Select the layer you want and click Add
WMS/WMTS layers are great when you need imagery that updates frequently-such as cloud-free Sentinel-2 mosaics or natural color layers refreshed every few days. However, they are usually compressed, meaning they’re better for viewing than for pixel-level analysis.
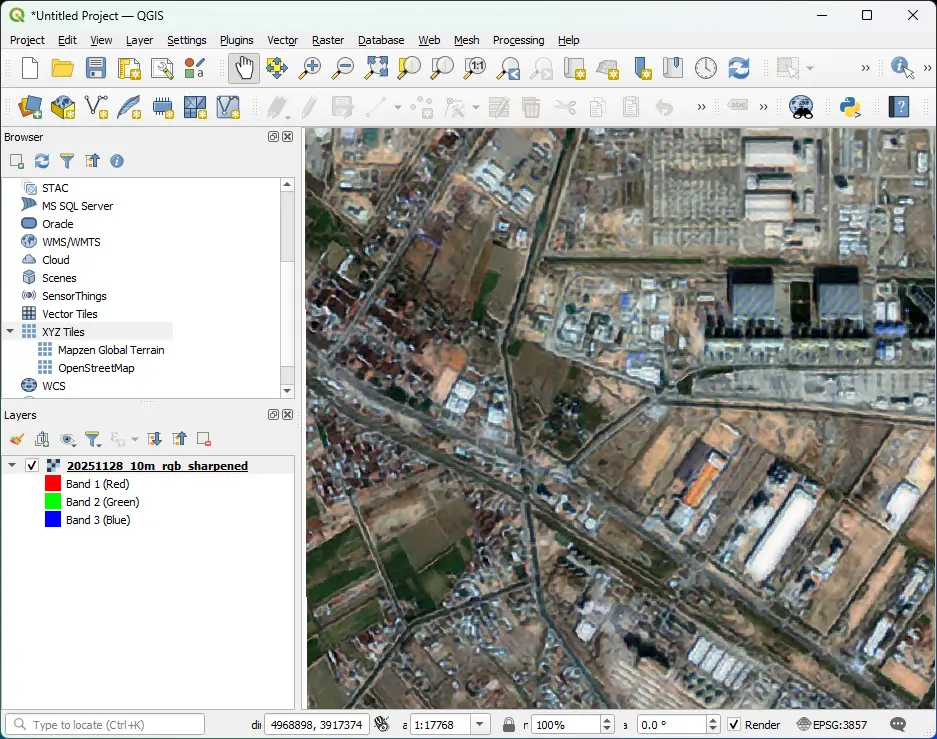
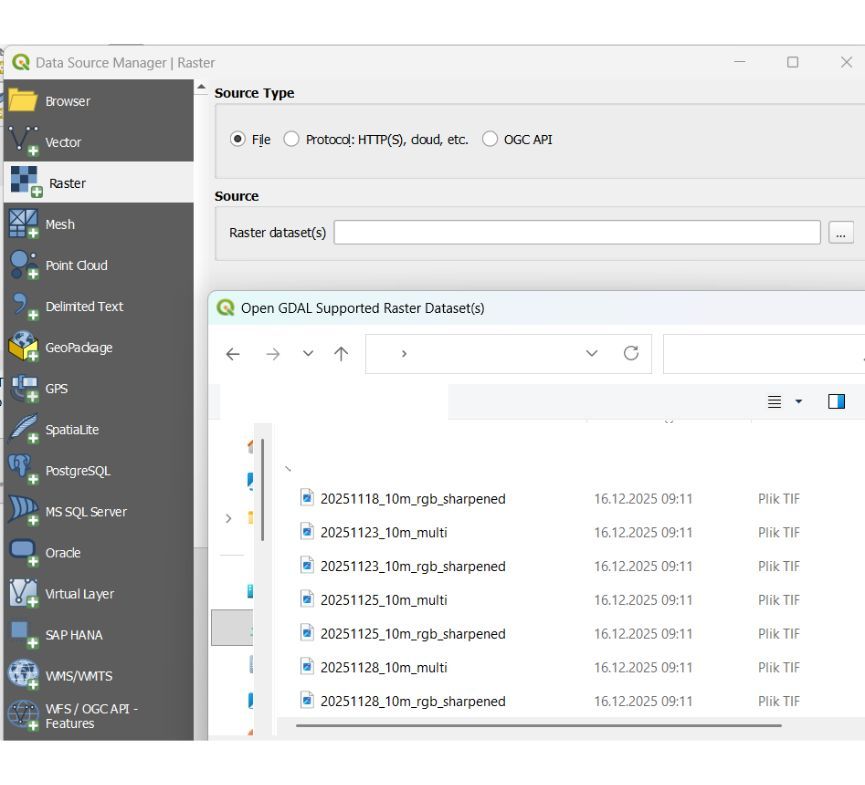
Method 3: Loading Satellite Imagery from Local Raster Files (GeoTIFF, JPG, PNG)
If you already downloaded satellite imagery (e.g., from USGS EarthExplorer, Copernicus OpenHub, Sentinel Hub, OpenAerialMap), QGIS lets you load it like any other raster.
Steps
Open QGIS
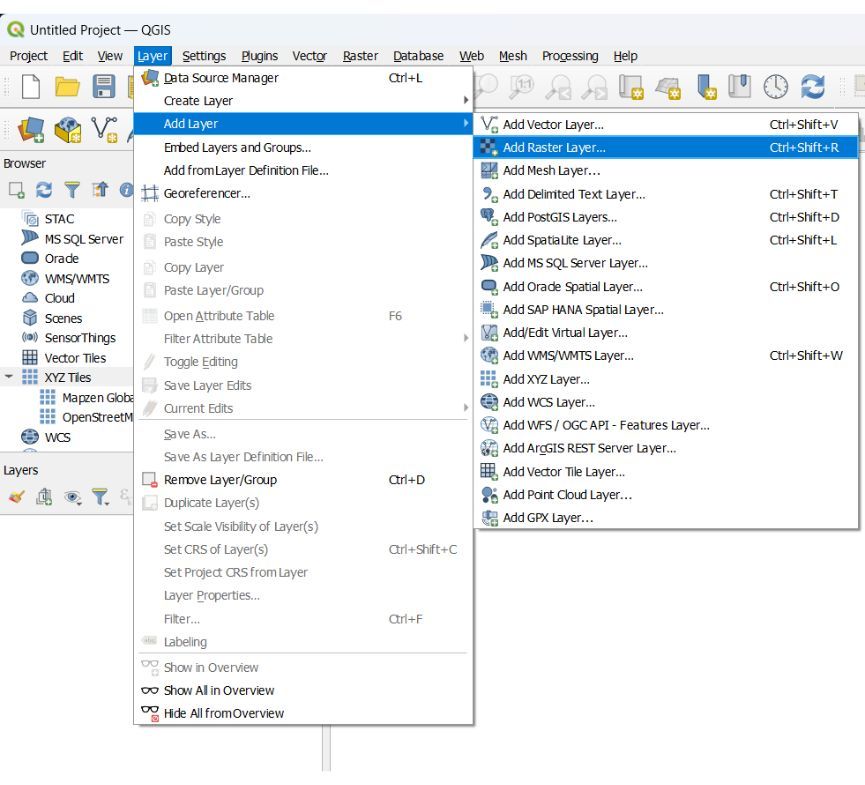
Go to Layer → Add Layer → Add Raster Layer
Under Source, click … and browse to your file
Select your GeoTIFF (.tif), JPG, PNG, or .img file
Click Add → Close
What QGIS Does Instantly
Displays the imagery on the map
Preserves band structures
Reads embedded metadata
Auto-applies a basic visualization
Allows you to build true color, false color, NDVI, NDBI, etc.
Best For
GIS analysis workflows
Machine learning prep in Python
Working without internet
Pro Tip: If Your Image Looks Very Dark or Very Bright
This is normal for satellite imagery.
Fix it by:
Layer → Properties → Symbology → Min/Max → Apply → Stretch to MinMax
Tips for Best Results When Using Satellite Imagery in QGIS
1. Always Set the Correct CRS (Coordinate Reference System)
For web maps (XYZ tiles): use EPSG:3857
For scientific analysis: use your project’s UTM zone
Why it matters:
Accurate area calculations, distances, and spatial analysis depend on the correct CRS.
2. Use “Stretch to Min/Max” for Cleaner Imagery
Raw satellite imagery can look too dark or too light.
Fix it:
Layer → Properties → Symbology → Min/Max → Stretch to MinMax
It enhances contrast and makes features (roads, farms, water, vegetation) stand out.
3. Group Your Layers to Avoid a Messy Project
Satellite data comes with many files (bands, metadata, masks).
Right-click the Layers panel → Add Group.
This keeps your workspace clean.
4. Build True/False Color Composites for Better Insights
Use the Raster → Misc → Build Virtual Raster (VRT) to combine bands.
Examples:
True Color: 4-3-2 (Sentinel-2)
False Color (vegetation): 8-4-3
Geology: 12-11-2
5. Turn on “Rendering → Eye Dome Lighting (EDL)” for Hillshade & DEM
If you're visualizing elevation or terrain:
View → Panels → 3D Map View → Enable EDL
This makes terrain pop, especially useful for valleys, slopes, and drainage mapping.
6. Use SCP (Semi-Automatic Classification Plugin)
For classification, NDVI, band math, and downloading Sentinel/Landsat easily:
Search SCP in Plugins
Install
Connect to Sentinel or Landsat
Automate band downloads and processing
Perfect for ML preprocessing
7. Cache XYZ Tiles for Offline Use
Right-click your XYZ tile layer → Properties → Cache → Enable
This caches imagery on your machine.
Great for areas with slow internet.
8. Clip Imagery to Reduce File Size
Large rasters slow QGIS.
Use:
Raster → Extraction → Clip Raster by Extent
Only keep what you need.
9. Save Your Style as a QML
After adjusting band rendering, right-click layer → Export → Save Style.
Useful when using the same settings across multiple files or projects.
10. Use “Raster Calculator” for NDVI / Water Index / Built-up Index
Examples:
NDVI: (NIR - Red) / (NIR + Red)
NDWI: (Green - NIR) / (Green + NIR)
NDBI: (SWIR - NIR) / (SWIR + NIR)
QGIS makes it easy and fast.
How OnGeo Intelligence Fits Into Your QGIS Satellite Imagery Workflow
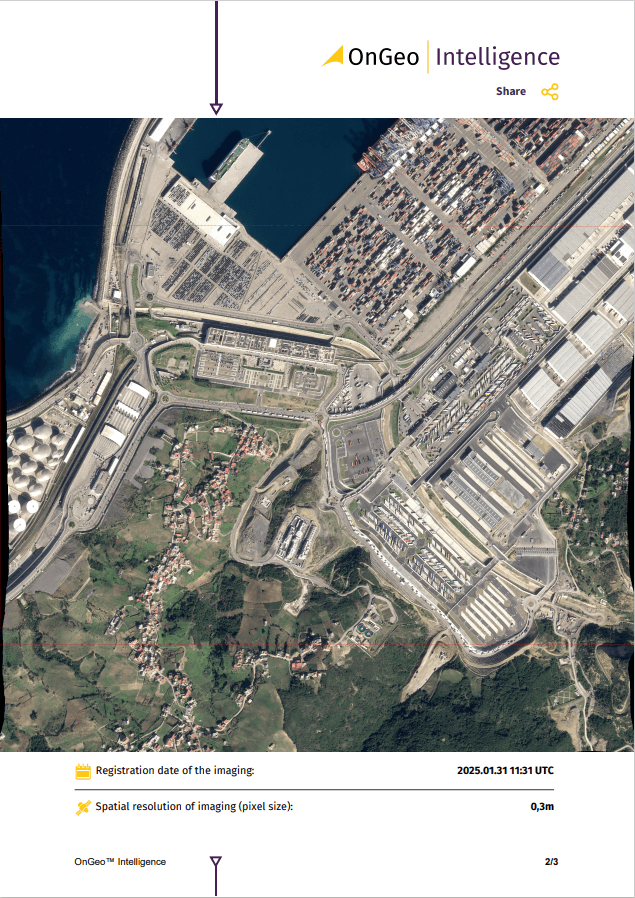
OnGeo Intelligence optimizes the satellite imagery discovery stage of the QGIS workflow by helping users identify the most suitable Sentinel-2 scenes before analysis begins. Instead of manually searching multiple satellite data portals, users receive a structured PDF report with key technical parameters such as acquisition dates, cloud cover percentage, scene footprints, and preview images.
This pre-selection process improves data quality in QGIS by reducing the risk of loading cloudy, outdated, or incorrect tiles. OnGeo Intelligence requires no user accounts or subscriptions, enabling fast access to satellite metadata and imagery selection. Free reports are available using the ongeo100 code.
By storing OnGeo Intelligence reports alongside QGIS project files, users maintain clear metadata documentation and traceability of imagery sources. This approach creates an efficient, reproducible workflow that separates satellite data discovery from geospatial analysis, improving accuracy and productivity in QGIS-based remote sensing projects.
Why Choose OnGeo Intelligence?
- Reliable source of spatial data.
- High-resolution imagery for precise analysis.
- Reliable and verifiable data.
- Comprehensive historical archives.
- For access to high-quality satellite imagery for your cases today.
Empowering Decisions with Open Satellite Data
Satellite imagery has become more accessible than ever, and QGIS provides a powerful platform to visualize, analyze, and extract insights from this data. However, the first step-finding the right imagery-can still be time-consuming and confusing, especially for beginners.
This is where OnGeo Intelligence shines. By simplifying scene discovery, offering clear reports, and removing subscription barriers, OnGeo bridges the gap between raw satellite data and actionable analysis in QGIS. Whether you’re a student, researcher, or professional, combining OnGeo Intelligence with QGIS lets you focus on understanding the Earth rather than struggling to manage files and metadata.
With the tools, tips, and workflow outlined in this guide, anyone can start exploring satellite imagery, performing basic analyses, and building meaningful geospatial projects. In 2026, the combination of free, high-quality satellite data and accessible GIS software empowers everyone-from hobbyists to organizations-to make informed decisions using real-world observations from space.
Related articles
- How to Get Satellite Imagery for Free: Complete 2026 Guide
- Understanding DEM, DTM and DSM in Satellite Earth Observation
- Why Metadata Is Essential in Satellite Earth Observation
- Why Accuracy Matters in High-Resolution Satellite Imagery
- Where to Find Satellite Imagery from a Specific Period? Explore OnGeo Intelligence Archives!
- How Often Does Google Maps Update Satellite Images?
- How to Download High-Resolution Satellite Images