Satellite Imagery vs. Field Surveys: How Remote Sensing Measures the Economic Cost of War
When a missile hits a power plant, a refinery or an apartment block, the first question is physical: what was destroyed? The second one decides what happens next: what is it worth? Insurers, development banks, humanitarian agencies and reconstruction planners all need a number, and for decades that number came from teams walking the rubble with clipboards.
In a war zone that model breaks down. Remote sensing accelerates post-war loss assessment from months to days when ground access is impossible. A 4-step pipeline (Detect, Classify, Value, Validate) converts pixel changes into financial metrics using Optical, SAR, and Night-Time Light (NTL) data. Combined SAR and NTL models correlate with official IMF economic impact estimates within acceptable margins.

Why field surveys fail where damage assessment matters most
Satellite-based economic damage assessment is the integration of high-resolution optical imagery, Synthetic Aperture Radar (SAR), and Night-Time Light (NTL) proxy data to estimate capital stock loss and GDP reduction in inaccessible conflict zones.
Traditional loss assessment relies on people on the ground: engineers inspecting structures, adjusters photographing property, enumerators counting households. It is accurate at building level, and it is also:
- Slow. Comprehensive surveys of a large region can take a year or more, long after reconstruction financing decisions are made.
- Dangerous or impossible. Unexploded ordnance, active front lines, evacuation orders and communication blackouts keep assessors out. In southern Lebanon, large areas remain closed to residents and inspectors alike.
- Expensive and patchy. Teams reach accessible neighbourhoods first, so the picture is biased toward places that are easiest to visit.
- Hard to repeat. A single survey gives one snapshot. War changes weekly.
Satellites invert every one of these constraints. They revisit the same place on a schedule, they cover entire cities in a single pass, and they leave a permanent, time-stamped record that can be audited later. As we showed in our coverage of Sudan, when access to the ground is blocked, space-based data becomes the primary witness.
From pixels to dollars: how the pipeline works
A map of destruction is not yet an economic estimate. Turning one into the other is a four-step chain.
- Detect. Identify which structures and areas changed between a pre-war baseline and a current observation.
- Classify. Work out what was damaged: housing, commercial space, industry, energy, ports, public services.
- Value. Link the damage to money, either through replacement-cost assumptions per building type or through economic proxies such as night-time light.
- Validate. Check the result against independent sources: official statistics, field samples, other sensors.
Each step relies on a different kind of satellite data.
Very-high-resolution optical imagery
Identifies visible damage, including collapsed roofs, craters, burn scars and rubble. Its main advantage is ease of interpretation, making before-and-after comparisons suitable for evidentiary purposes. However, observations can be obstructed by clouds, smoke and darkness, and reliable assessment requires a suitable pre-event baseline.
Synthetic aperture radar (SAR)
Detects changes in surface and structural characteristics independently of daylight and, to a large extent, cloud cover and smoke. Its capacity for repeated observations makes it useful for monitoring affected areas. Interpretation is less straightforward than for optical imagery and often requires specialist processing.
Night-time lights
Measure the intensity and spatial distribution of artificial illumination, providing an indirect indicator of economic activity, electricity use and commercial activity. The main limitation is that changes in illumination may reflect power outages or infrastructure disruptions rather than changes in economic output alone.
Land-use and building-footprint data
Identify the types of buildings and land uses affected, helping attribute observed damage to specific sectors or activities. Their usefulness depends on the completeness, accuracy and geographic coverage of available mapping data, which remain uneven across regions.
High-Resolution Optical Satellite Imagery for Visual Damage Assessment
High-resolution optical imagery is the layer people understand instantly. Place an image from before the war next to one from after it and the story needs no caption.
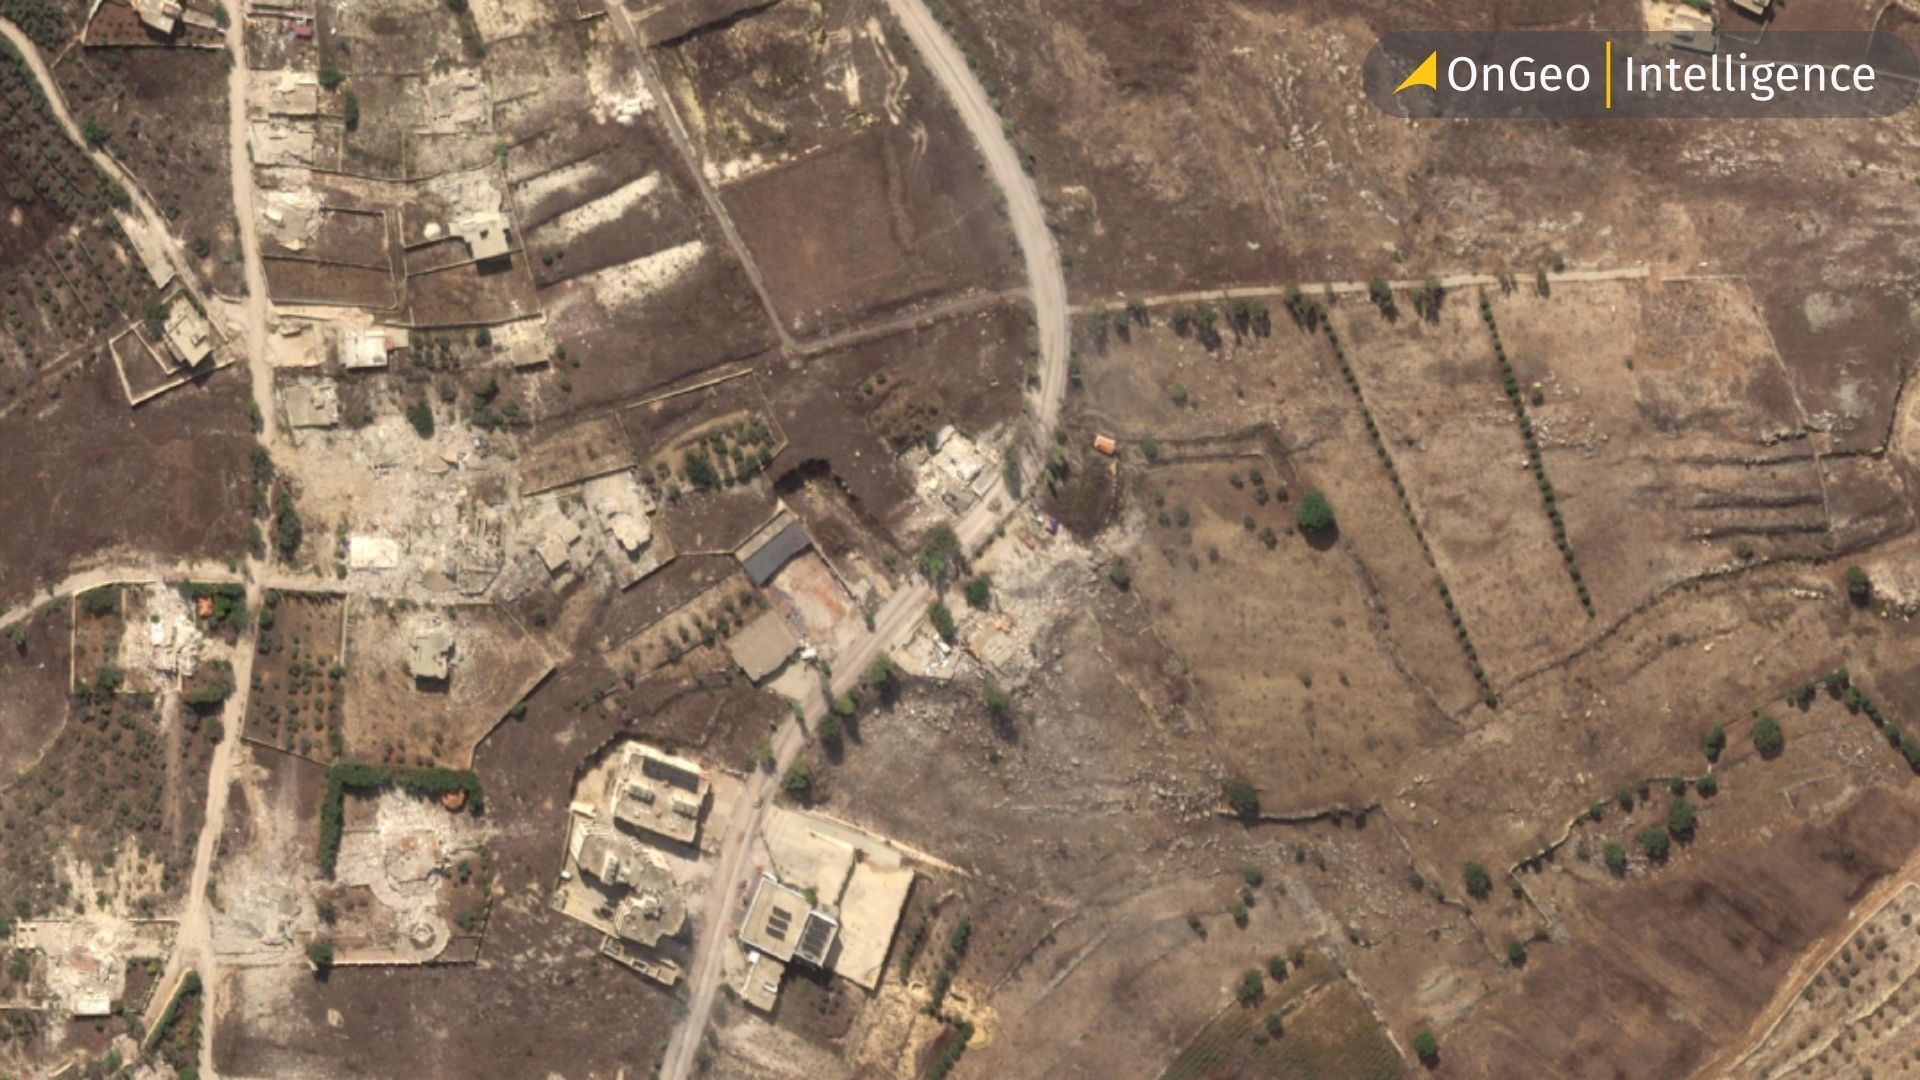
In Gaza City, before/after pairs from late summer 2025 documented entire districts converted to bare ground. Our analysis tracked more than 1,500 residential and commercial buildings lost in Zeitoun alone, and showed the demolition process itself, including heavy machinery staged at the edge of cleared blocks. In southern Lebanon, PlanetScope comparisons from March and May 2026 showed that at least 46 of 54 towns and villages inside the border-adjacent zone had been heavily damaged or flattened within about two months.
Optical data also reveals the economic geography of a war. In the Gulf, imagery covered in our Middle East overview showed smoke over Jebel Ali Port and the Ras Tanura refinery. The physical damage at Ras Tanura was reported as limited, yet global oil prices reportedly jumped about 8% within hours. That gap is exactly why economic damage assessment cannot stop at counting broken buildings: a small, visible event at a critical node can carry a very large price tag.
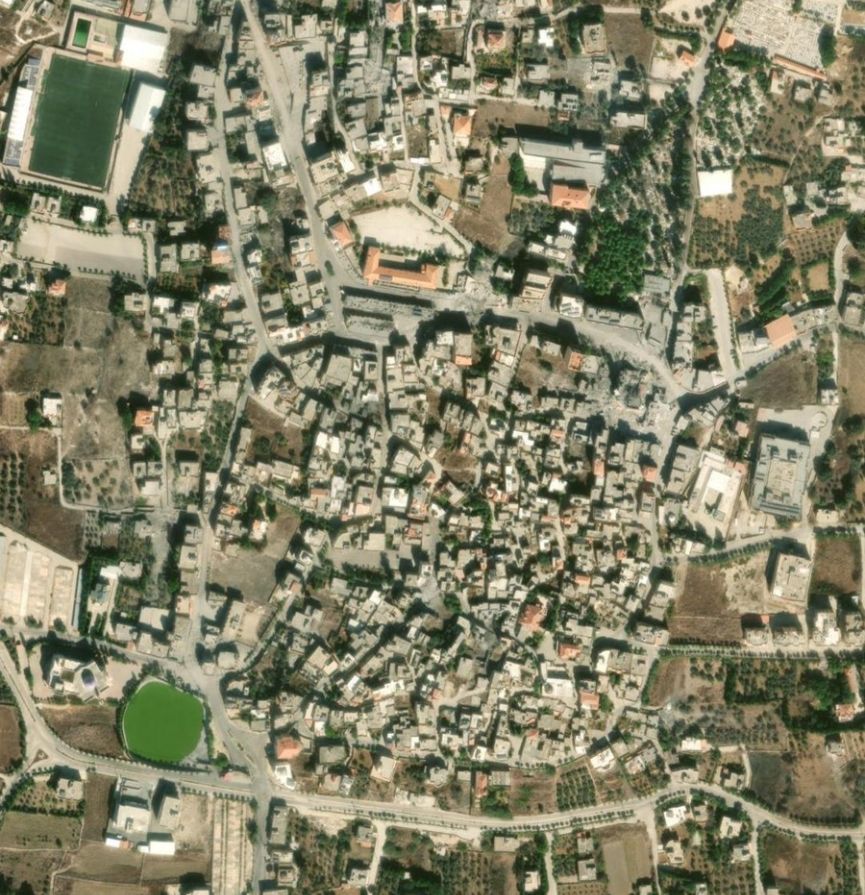
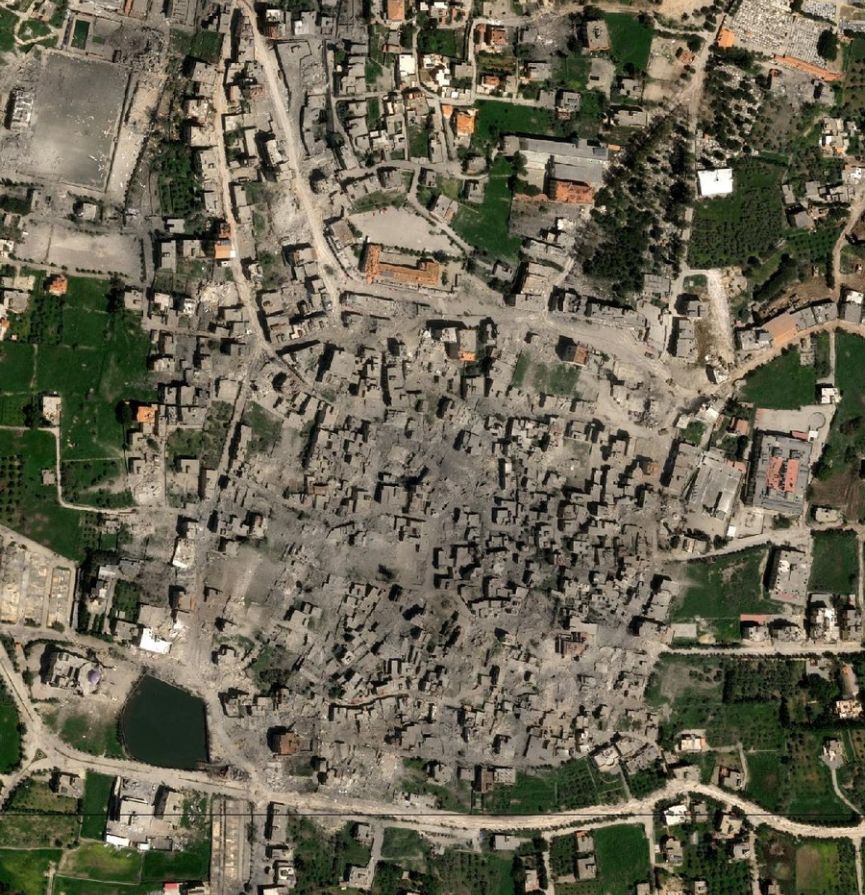
Before-and-after satellite imagery of Bint Jbeil, Lebanon, revealing extensive destruction and large-scale damage across residential areas following the 2026 conflict.
Synthetic Aperture Radar (SAR) for All-Weather Damage Detection
Optical satellites are blind in the dark and under cloud, and battlefields are famously smoky. Synthetic aperture radar (SAR) solves this. Radar actively illuminates the ground and records how the signal returns; when a building collapses, the return pattern changes. Comparing radar scenes over time lets analysts flag likely structural damage across a whole country with free, regularly updated data from missions such for example as Sentinel-1.
That is how researchers estimated that nearly 60% of Gaza's building stock had been damaged or destroyed, and it is how analysts mapped destruction in Lebanon, where radar analysis confirmed the scale seen in optical images.
Night lights turn destruction into an economic signal
Counting rubble tells you about capital stock. It does not tell you how much output has disappeared. For that, economists use night-time light: the brighter a city glows after dark, the more shops, factories, transport, offices and households are running.
The Gaza study that brought this approach into the mainstream combined three ingredients:
- Weekly radar scenes tracking physical damage from October 2023 into autumn 2024;
- Night-light intensity as a stand-in for economic activity;
- An econometric model calibrated on pre-war GDP and income statistics, then applied to wartime conditions where no surveys were possible.
Its findings show how powerful the method can be:
- About 82% of the territory was damaged at least once during the observation period.
- Night-time light fell by roughly 68.5%.
- Average losses in output and household welfare reached around 75%, rising to 97% in the worst-hit areas.
- Total economic losses were estimated at about US$2.6 billion.
The method also passed a sanity test. During the short truce in November 2023, the data registered a brief rise in night-time brightness, evidence that the signal reacts to real changes in daily life rather than noise.
Satellite Data Type | Best Used For | Key Advantage | Main Limitation |
|---|---|---|---|
Optical Imagery | Visible surface damage, craters, clear before/after proof | Intuitive visual evidence for non-experts | Blocked by clouds, smoke, and night |
SAR (Radar) | Structural changes, collapse detection | Penetrates clouds, smoke, and operates at night | Requires complex processing & baseline data |
Night-Time Lights | Economic output & proxy for GDP decline | Measures active human/commercial activity | Affected by temporary power outages vs actual destruction |
Does satellite economics hold up against official numbers?
The most convincing test is triangulation. In Iran, the government put total direct and indirect damage from air strikes at roughly US$270 billion, while the IMF projected a hit of around US$300 billion to 2026 GDP. Satellite-derived estimates landed in the same neighbourhood. They are different measures built from independent evidence, and they are consistent in scale. Increasing the resolution and combining optical, radar and thermal data narrows the gap further, with results that would otherwise take at least a year of fieldwork.
Who uses satellite damage evidence, and for what
- Humanitarian and development organisations need fast, defensible damage figures to justify reconstruction financing in places staff cannot reach. See how satellite imagery improves crisis management.
- Insurers and reinsurers use objective before/after evidence to triage claims in dangerous regions and reduce reliance on in-person adjusters. Read how insurance companies use satellite imagery for damage assessment.
- Sanctions, compliance and due-diligence teams monitor activity at ports, plants and industrial sites in restricted territories.
- Reconstruction planners rank districts by severity to allocate scarce funds where they matter most, which is impossible without spatial data.
- Lawyers, journalists and investigators rely on time-stamped imagery as evidence in judicial proceedings.
- Property owners and families abroad use imagery to confirm what happened to homes they cannot visit. Dozens of Lebanese families living abroad have already used OnGeo Intelligence imagery to check the status of their houses.
How OnGeo Intelligence helps you get the evidence layer fast
Every economic damage model starts with the same raw material: a trustworthy baseline image, a current image and a clear comparison between them. That is where OnGeo Intelligence fits in. We have followed conflicts from Gaza and Lebanon to Iran and Sudan, and the same workflow supports all of them:
- One place to find imagery. OnGeo aggregates commercial satellite data in a searchable interface, so you do not negotiate with several vendors.
- Historical archive for baselines. Pull images from before the event to make credible before/after comparisons. Learn where to find imagery from a specific period and how satellite imagery archives work.
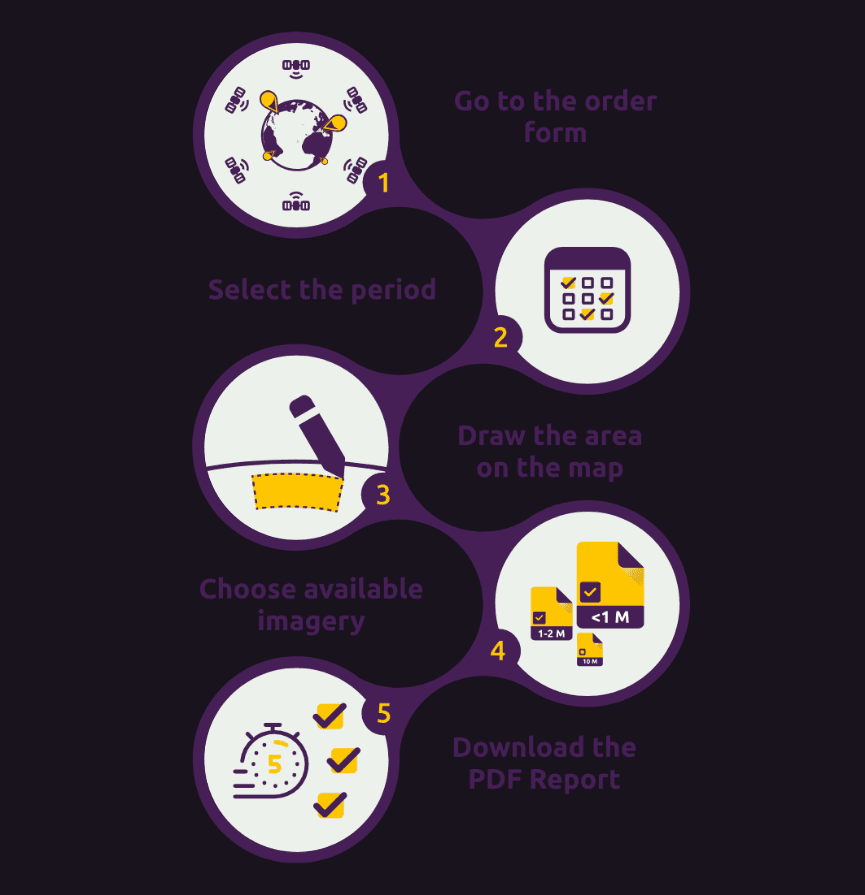
- Fast, simple ordering. Choose a location, a date range and a resolution; no registration and no contracts. Your imagery arrives as a downloadable PDF report with clear visuals.
- Repeat monitoring. Re-order the same area to track urban change as demolition, clearance or reconstruction continues.
- Evidence you can hand to someone else. Annotated, time-stamped imagery is easy to attach to an insurance file, a donor report or a legal submission.
How to order satellite imagery of an affected area
- Open the OnGeo Intelligence order page.
- Search by place name or draw your area of interest on the map.
- Select the date range, including a pre-event baseline.
- Pick the resolution and coverage that fit your purpose.
- Check out securely and download your report.
Need to see what a report looks like first? Download a sample OnGeo Intelligence satellite imagery report.
Frequently asked questions
Can satellites really replace field surveys after a war?
Not entirely, and they do not need to. Satellites replace the first and most dangerous phase: wide-area, repeatable, time-stamped assessment of where damage occurred and how large it is. Targeted ground validation is still valuable for building-level valuation, insurance payouts and legal claims.
How do satellites measure economic damage rather than just destruction?
They combine physical damage detection (optical and radar) with economic proxies, especially night-time light, and calibrate both against pre-war statistics. The result is an estimate of lost output, welfare or capital, expressed in money.
What is SAR and why is it useful in conflict zones?
Synthetic aperture radar is an active sensor that images the ground through cloud, smoke and darkness. Because it works in any weather and at any hour, it provides consistent monitoring where optical satellites are blocked.
How accurate are satellite-based damage estimates?
Accuracy depends on resolution, baseline quality and method. Validated approaches reach building-level accuracy around AUC 0.87 against UN-labelled data, and national totals have matched the order of magnitude of official and IMF estimates. They are best treated as strong, transparent estimates with stated uncertainty.
Can I use satellite imagery to document damage to my own property?
Yes. Ordering before-and-after imagery of an address or village is a practical way to confirm the condition of property in inaccessible areas and to support an insurance or compensation claim. Check with your insurer which evidence they accept.
How quickly can I get satellite imagery of a conflict area?
With OnGeo Intelligence you can search, select and download a satellite imagery report in minutes, subject to what is available over the area and dates you need.
Related articles
- Land Disputes: How Satellite Imagery Helps Prove Who Owns, Built or Used What and When
- How Satellites Save Lives During Natural Disasters Within Hours
- How Satellites Monitor Climate Change
- Understanding Satellite Imagery Resolution: Spatial Tiers, Market Dynamics, and Licensing Realities
- Shocking Satellite Images from Nepal Deadly Flash Flood