What Is Satellite Imagery? A Complete Beginner’s Guide
In 2025, satellite imagery has evolved into one of the most powerful tools for understanding and managing our planet - from real-time environmental monitoring to precision urban mapping. Every day, hundreds of satellites orbit Earth, capturing data that helps us track climate change, map infrastructure, monitor crops, and respond to disasters.
This guide explains what satellite imagery is, how it works, the different types available, key analytical formulas, and why it matters. Whether you’re a student, researcher, or professional, you’ll gain a clear foundation for understanding one of today’s most transformative Earth observation technologies.
What Is Satellite Imagery?
Satellite imagery refers to images of Earth captured by sensors mounted on satellites orbiting the planet. These sensors record reflected or emitted energy from the Earth’s surface across different parts of the electromagnetic spectrum - including visible light, infrared, and radar wavelengths. The data is then processed into visual images that help scientists, governments, and businesses observe, analyze, and understand changes happening on the ground.
Unlike traditional aerial photography taken from planes or drones, satellite imagery covers much larger areas - even entire continents - and can be collected at regular intervals to monitor changes over time. This consistency and scale make it an invaluable tool for mapping, environmental monitoring, and urban planning.
At its core, satellite imagery is a key component of remote sensing, the science of observing the Earth without direct contact. Each image captures information about surface features like vegetation, water, soil, or infrastructure.
Today, with improvements in satellite technology, images can reach resolutions of 30 centimeters or better, meaning individual vehicles or small structures can be identified from space. Combined with cloud platforms and AI tools, satellite imagery has become more accessible, faster to process, and more insightful than ever before.
Why Satellite Imagery Matters?
Satellite imagery isn’t just about stunning pictures of Earth - it’s about insight. Behind every pixel lies valuable data that helps governments, businesses, and researchers make informed decisions.
From tracking deforestation in the Amazon to monitoring urban growth in Africa’s fastest-growing cities, satellite imagery enables us to see patterns invisible to the human eye. In agriculture, it helps farmers optimize irrigation and detect crop stress before it’s visible on the ground. In disaster management, it provides rapid situational awareness - allowing responders to assess floods, fires, or earthquakes in near real time.
As Earth’s challenges become more complex - from climate change to resource management - satellite imagery provides the objective, global perspective we need to act intelligently. In short, it turns observation into understanding, and understanding into action.
How Satellite Imagery Works: From Space to Your Screen
The process of transforming an image taken hundreds of kilometers above Earth into the clear maps and datasets we use every day is both complex and fascinating. Satellite imagery relies on three key elements: satellites, sensors, and ground processing systems that turn raw data into usable information.
Sensing the Earth’s Surface
Satellites are equipped with sensors that detect reflected or emitted electromagnetic energy from the Earth’s surface. Depending on the type of sensor:
- Optical sensors detect visible and infrared light - useful for natural color images and vegetation analysis.
- Radar sensors (SAR) send out microwave signals and measure their return, allowing them to see through clouds and even at night.
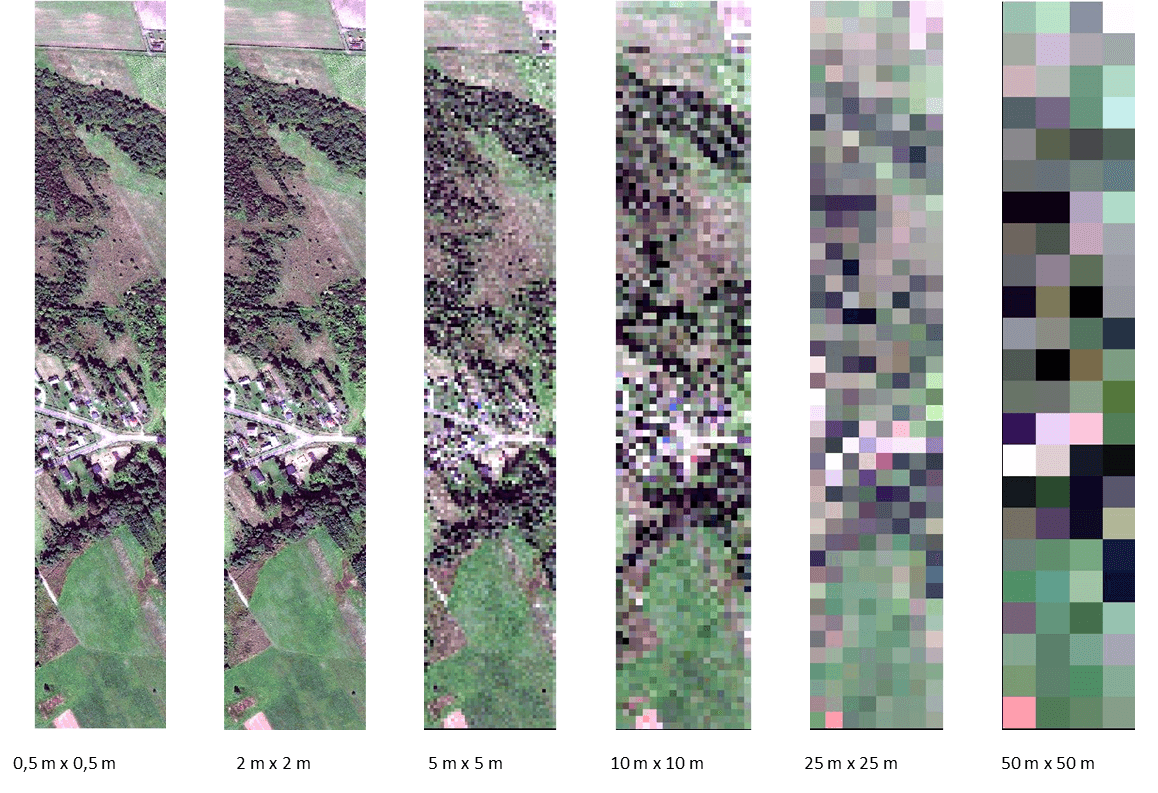
Each pixel in a satellite image represents a measurement of energy from a specific area on the ground - ranging from 30 meters for medium-resolution sensors to under 0.3 meters for high-resolution commercial satellites.
Capturing Data from Orbit
Satellites orbit the Earth along carefully designed paths. Most Earth observation satellites operate in one of two main types of orbits:
- Geostationary orbit (GEO): Positioned about 36,000 km above the equator, these satellites appear stationary relative to the Earth’s surface. They’re ideal for weather monitoring and communications because they continuously observe the same region.
- Polar orbit (LEO): These satellites travel from pole to pole, capturing images of the entire planet as the Earth rotates beneath them. This is the most common orbit for Earth observation satellites like Landsat, Sentinel, and WorldView.
Key Remote Sensing Formulas Used in Satellite Imagery Analysis
Satellite imagery isn’t just about capturing visual data - it’s about quantifying change. Analysts use mathematical formulas to extract meaningful insights from raw spectral information. Here are some of the most widely used ones:
I. Normalized Difference Vegetation Index (NDVI)
NDVI is the most common vegetation health index derived from satellite data. It measures how “green” or photosynthetically active vegetation is.

NIR – reflectance in the near-infrared band
RED – reflectance in the red band
Range: −1 to +1
Values close to +1 → dense vegetation
Values near 0 → bare soil or urban areas
Values below 0 → water or snow
Used with: Landsat (Band 5 & Band 4), Sentinel-2 (Band 8 & Band 4), MODIS
II. Enhanced Vegetation Index (EVI)
Improves upon NDVI by reducing atmospheric and soil background noise.
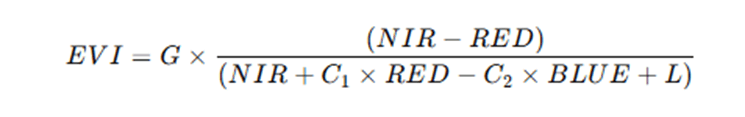
Typical constants:

Used with: MODIS, Sentinel-2
III. Land Surface Temperature (LST)
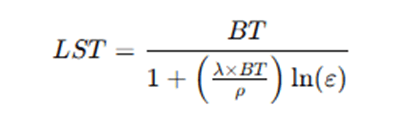
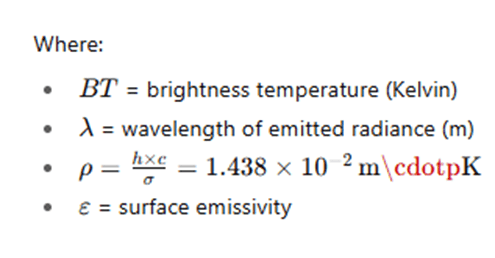
Derived from thermal infrared (TIR) bands using Planck’s law and emissivity corrections.
Transmission and Processing
Once collected, data is transmitted to ground stations, where it’s calibrated, corrected, and converted into usable images. Processing involves several steps:
- Geometric correction (aligning images with maps),
- Radiometric correction (adjusting for sensor or atmospheric effects), and
- Mosaicking (stitching multiple images together).
Modern cloud platforms like Google Earth Engine, Copernicus Data Space, and NASA’s Earthdata automate much of this, making high-quality imagery accessible to analysts and developers worldwide.
Delivery to End Users
After processing, satellite imagery becomes available through APIs, mapping platforms, or visualization tools - appearing as base maps, vegetation indices, or time-lapse animations. In essence, every map or environmental model you see online likely started as satellite data captured thousands of kilometers away.
Types of Satellite Imagery
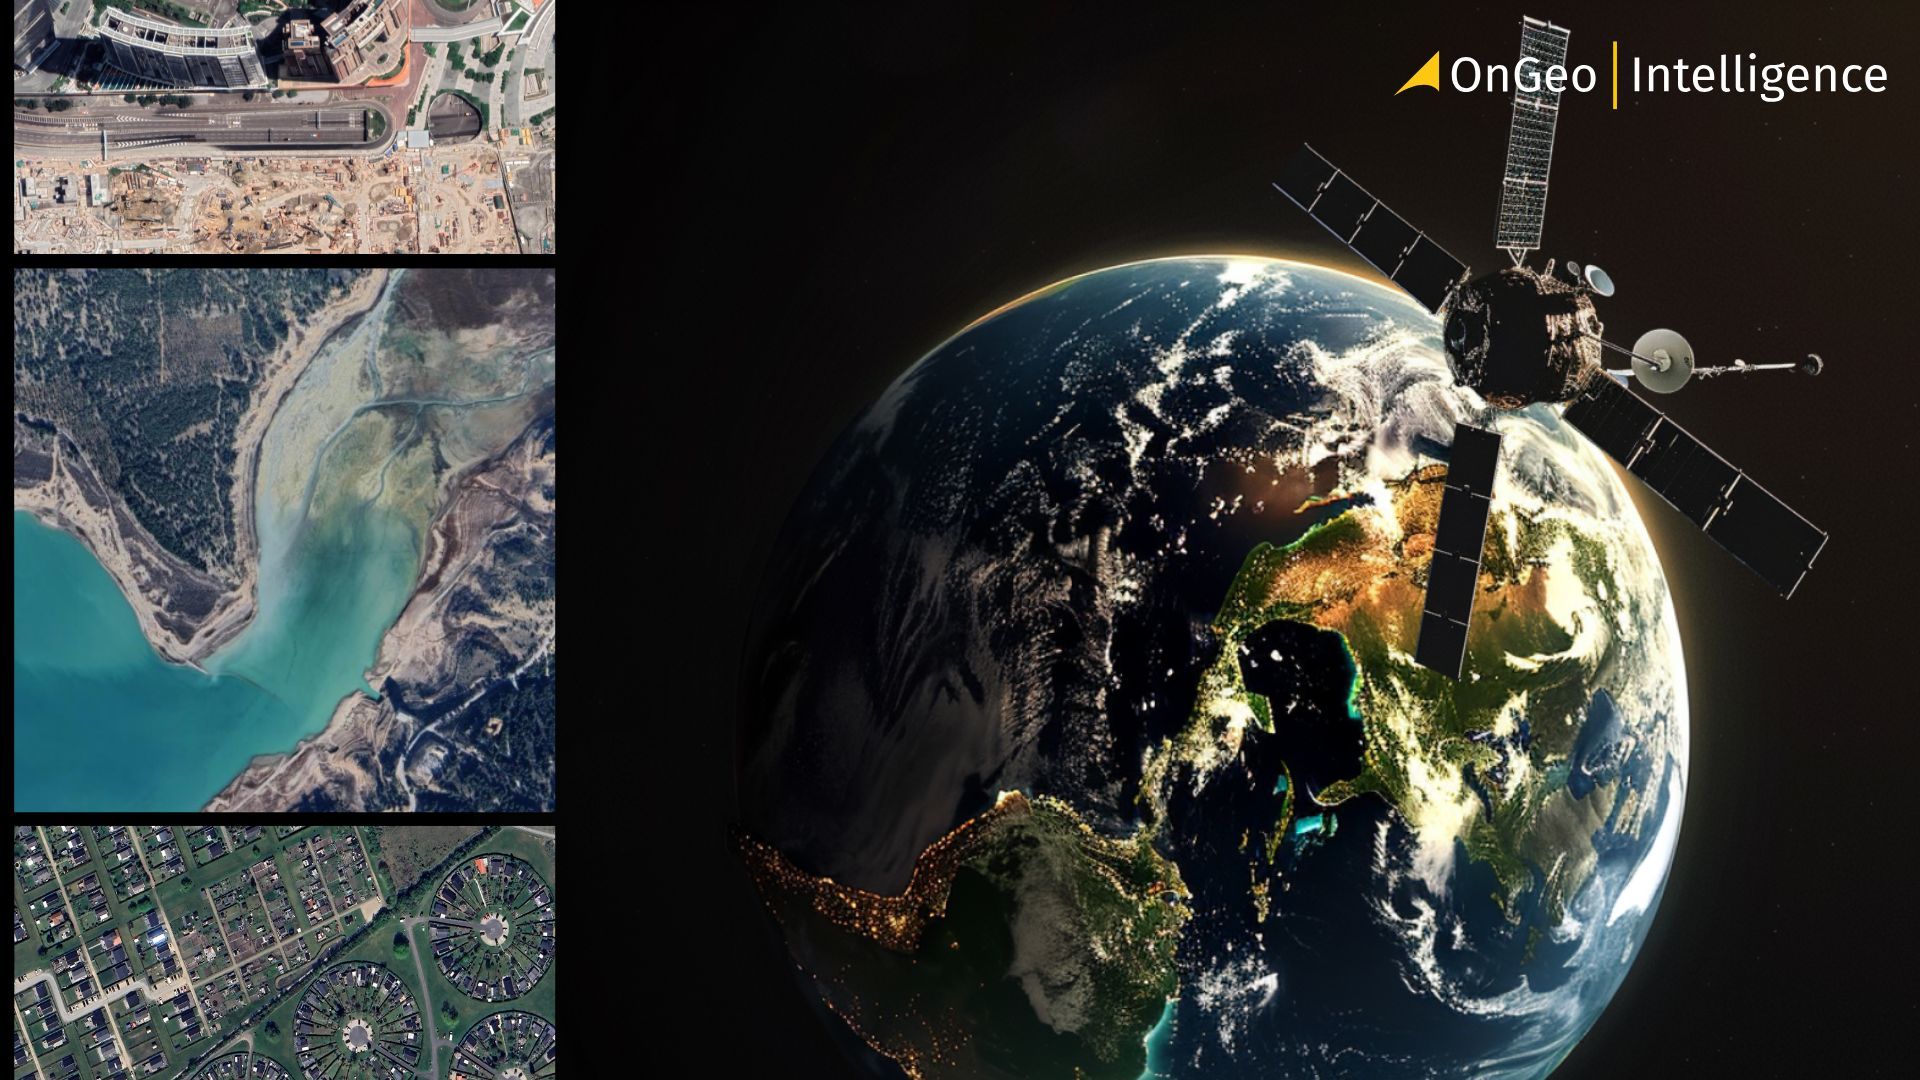
Not all satellite images are created equal. Depending on the sensor technology and data captured, satellite imagery can vary widely in how it looks and what it can reveal. Broadly, there are four main types of satellite imagery used in Earth observation: optical, radar, multispectral, and hyperspectral.
Optical Imagery
Optical satellite imagery captures light in the visible and near-infrared parts of the electromagnetic spectrum - the same light our eyes can see. These are the natural-color images most people recognize, such as those used in Google Maps or NASA’s Earth Observatory.
Optical imagery is ideal for:
Land cover classification (forests, cities, water, etc.)
Monitoring vegetation health
Tracking urban growth and infrastructure
However, optical sensors have limitations - they can’t see through clouds or at night, which restricts data collection in some regions.
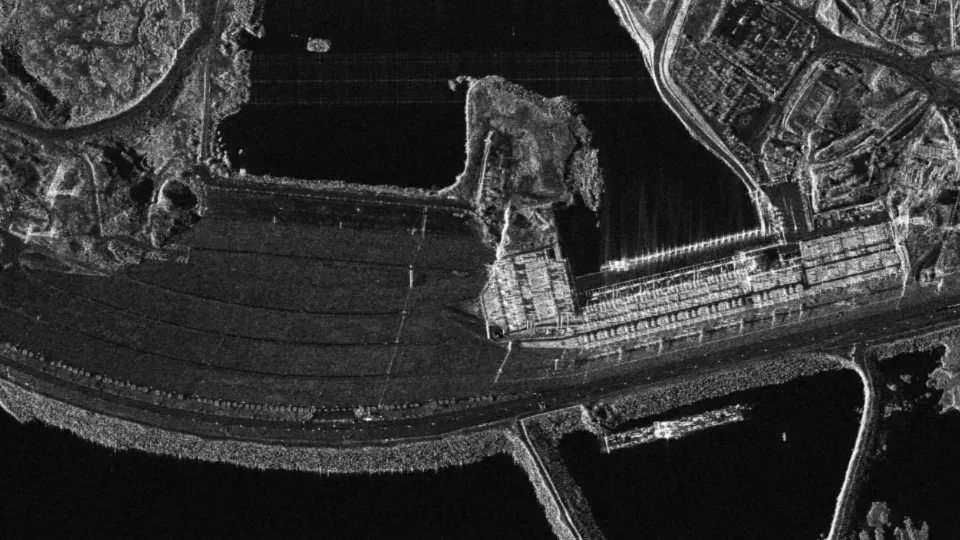
Radar Imagery (SAR – Synthetic Aperture Radar)
Radar satellites work differently: they emit microwave signals and measure how those signals bounce back from the Earth’s surface. Because microwaves can penetrate clouds and operate in darkness, SAR imagery provides consistent data regardless of weather or daylight.
Radar imagery is especially useful for:
- Flood and landslide mapping
- Soil moisture estimation
- Detecting changes in infrastructure or terrain
- Monitoring deforestation and disaster zones
Examples include Sentinel-1, RADARSAT, and TerraSAR-X satellites.
Multispectral Imagery
Multispectral satellites capture data across several distinct wavelength bands - typically between 3 and 10. For example, the Landsat satellites collect information in visible, near-infrared, and shortwave infrared bands.
This allows scientists to analyze the Earth’s surface beyond what the human eye can see. For instance, healthy vegetation reflects infrared light, so multispectral data helps measure plant health, crop conditions, and water stress.
Multispectral imagery is widely used in:
Agriculture and forestry
Environmental monitoring
Water quality assessment
Hyperspectral Imagery
Hyperspectral satellites take this concept even further - capturing hundreds of narrow spectral bands. This provides a detailed “spectral fingerprint” for every pixel, allowing precise identification of materials and land features.
While hyperspectral imagery produces massive amounts of data, it enables advanced applications such as:
- Mineral and soil analysis
- Pollution detection
- Precision agriculture
- Military and intelligence operations
Examples of hyperspectral missions include PRISMA, EnMAP, and HySIS.
Each type of satellite imagery offers unique insights. By combining them - for example, overlaying optical data with radar measurements - analysts can create richer, more accurate models of the Earth’s surface, even under challenging conditions.
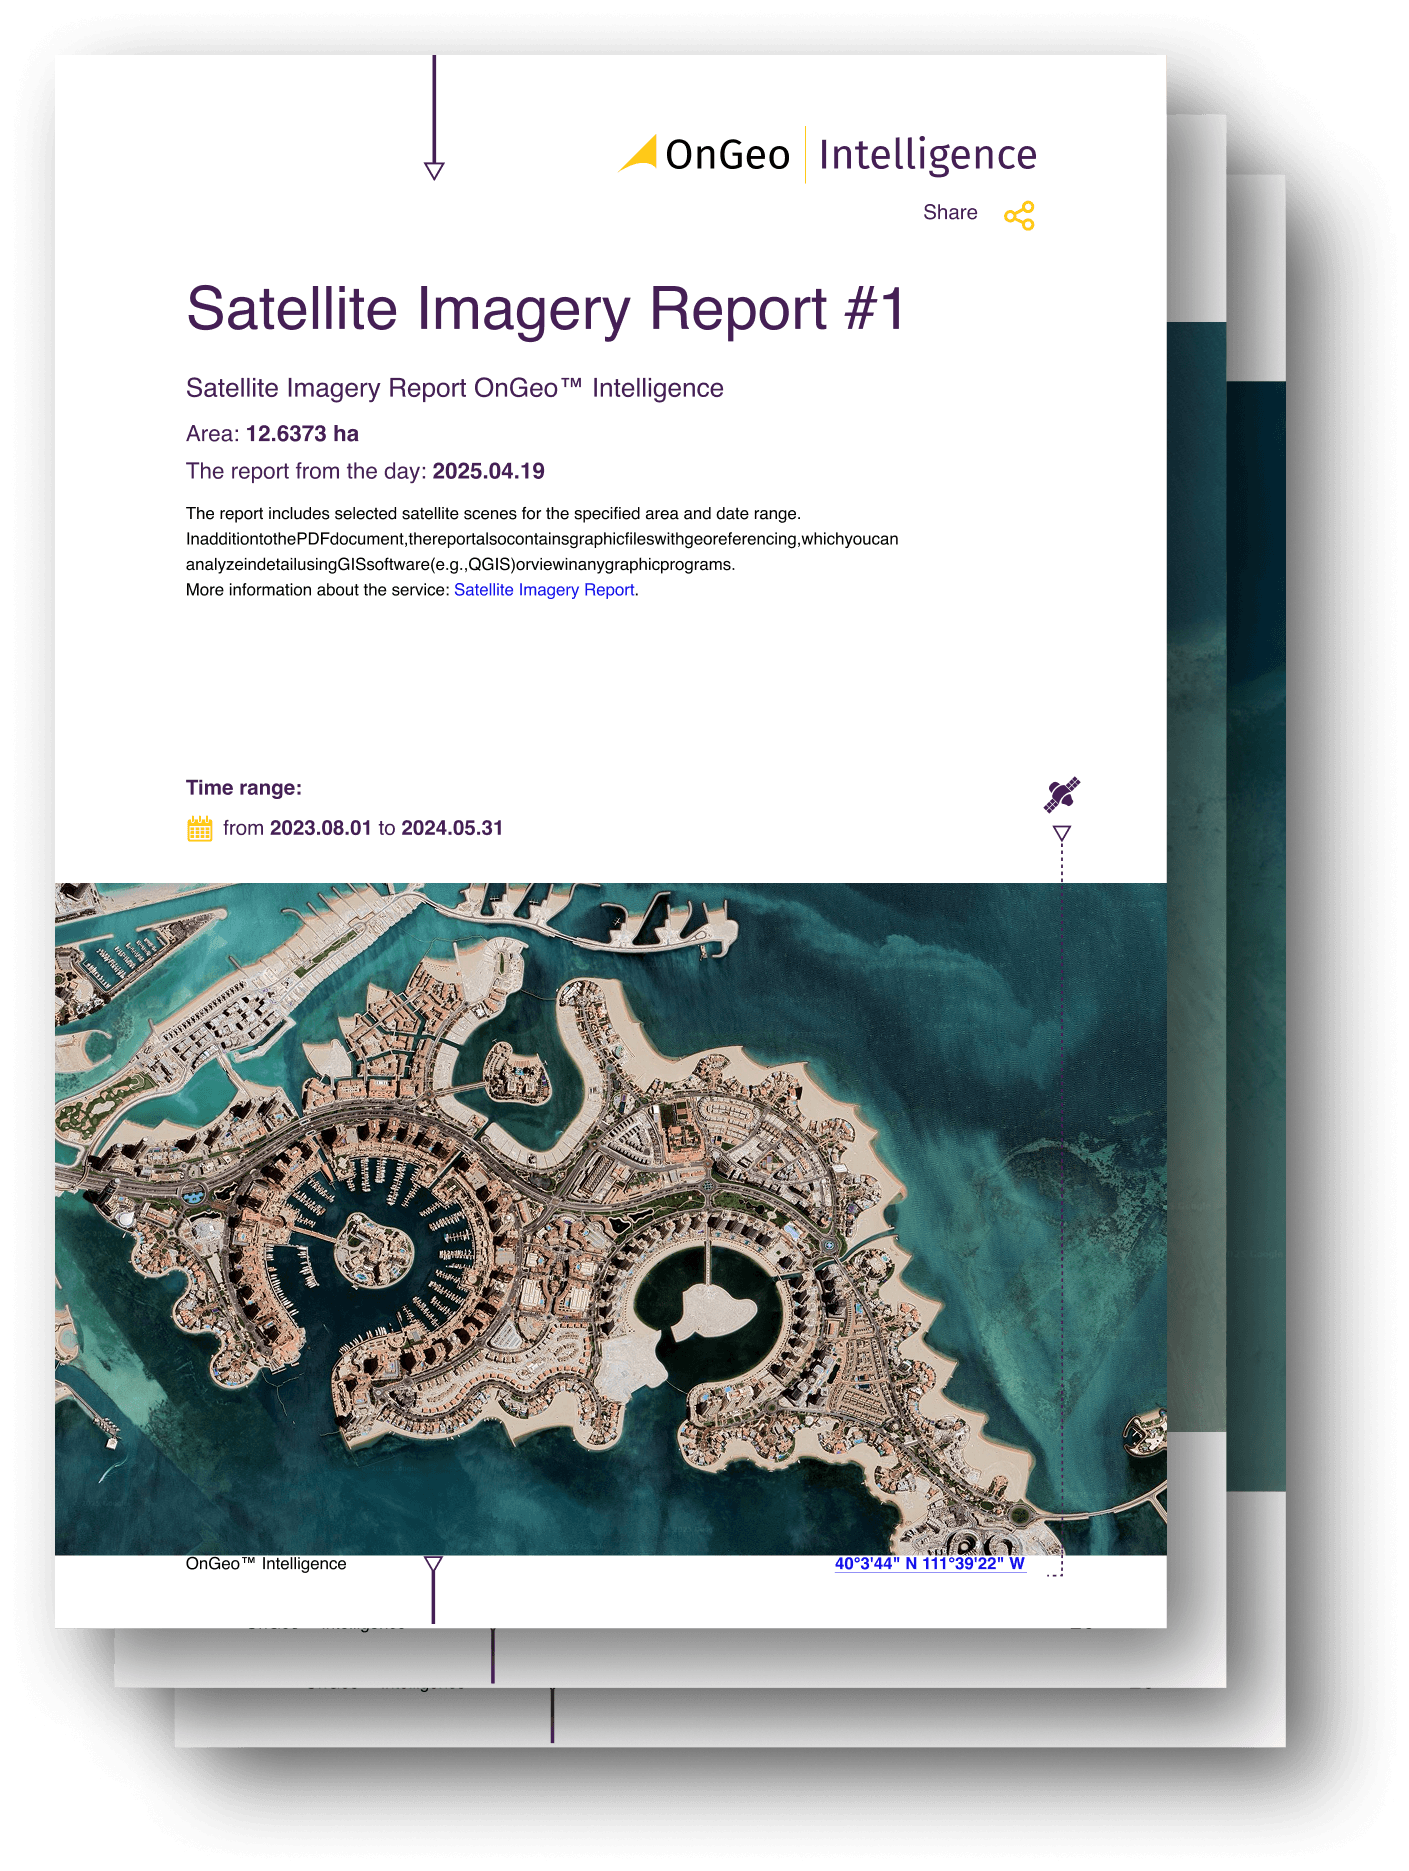
OnGeo Intelligence and Its Role in Satellite Intelligence
OnGeo is a geospatial intelligence platform designed to make satellite data more accessible and actionable for users across industries. It combines advanced remote sensing analytics, AI-driven data processing, and high-resolution satellite imagery to deliver precise insights about the Earth’s surface.
In the context of this article, OnGeo represents the next step in applying the principles of satellite imagery - transforming raw images into decision-ready intelligence. Whether for environmental monitoring, infrastructure planning, or risk assessment, OnGeo’s tools enable users to visualize, analyze, and interpret spatial data quickly and intuitively.
Final Thoughts
Satellite imagery has become one of the most powerful tools for understanding our planet. What began as a method for military reconnaissance and weather forecasting has evolved into an open, data-driven ecosystem that supports everything from precision agriculture and climate research to urban development and disaster response.
As technology advances, the combination of AI, cloud computing, and small satellites (CubeSats) is making Earth observation faster, more affordable, and more accessible. In 2025 and beyond, satellite imagery will continue to expand its role - not just in science, but in everyday decision-making across governments, businesses, and communities.
Related articles
- What is GEOINT? The Power and Limits of Geospatial Intelligence in the Modern World
- From Maxar to Vantor: A New Era in Satellite Earth Observation and Geospatial Intelligence
- Why Metadata Is Essential in Satellite Earth Observation
- ICEYE Gen4: Satellites That See the World in 16 cm Detail
- Where to Find Satellite Imagery from a Specific Period? Explore OnGeo Intelligence Archives!
- How Satellite Imagery Works: From Space to Your Screen